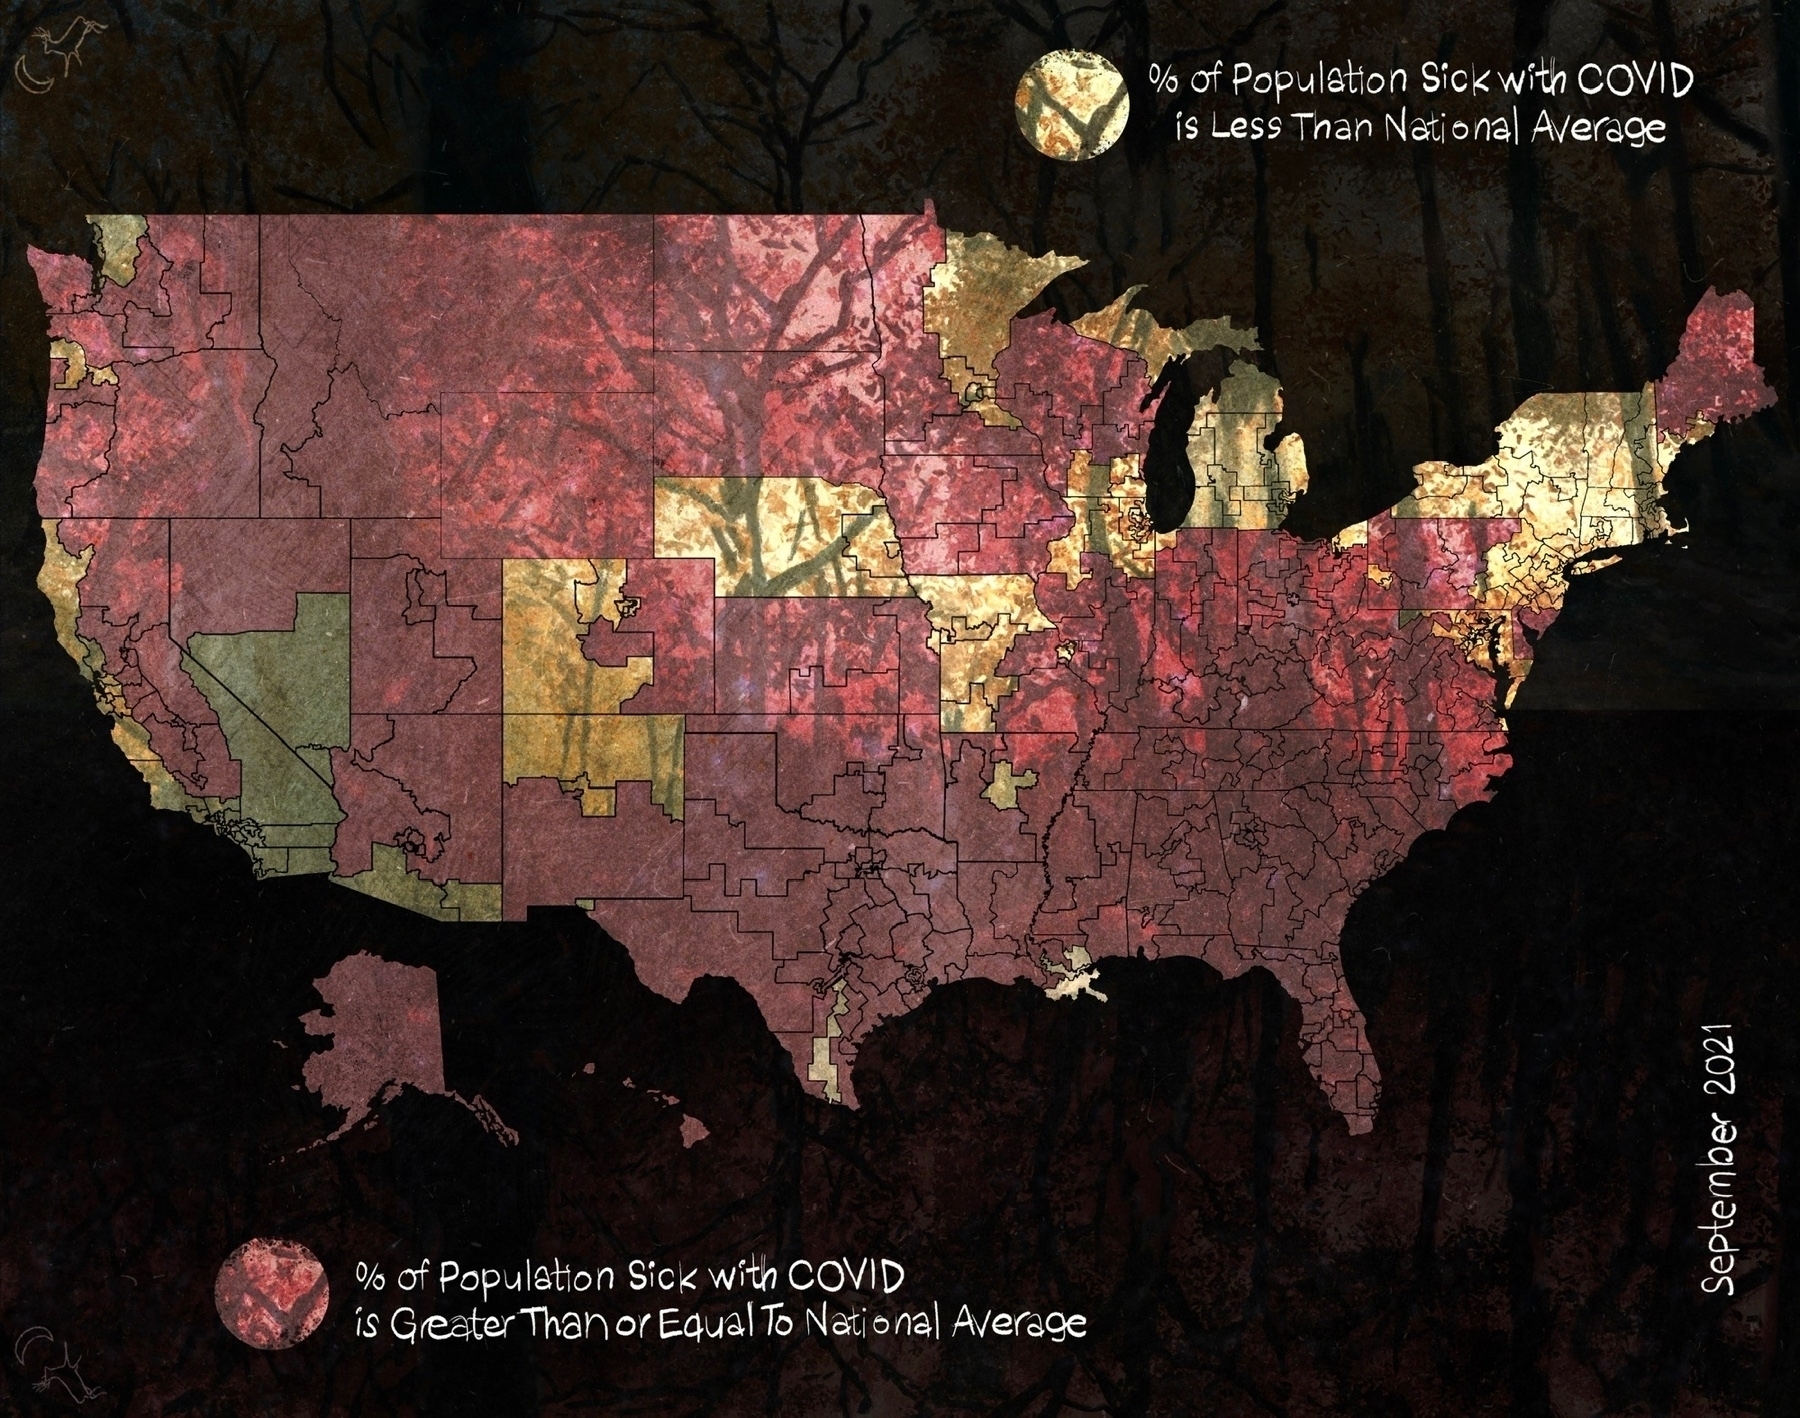
2021 #COVID cases
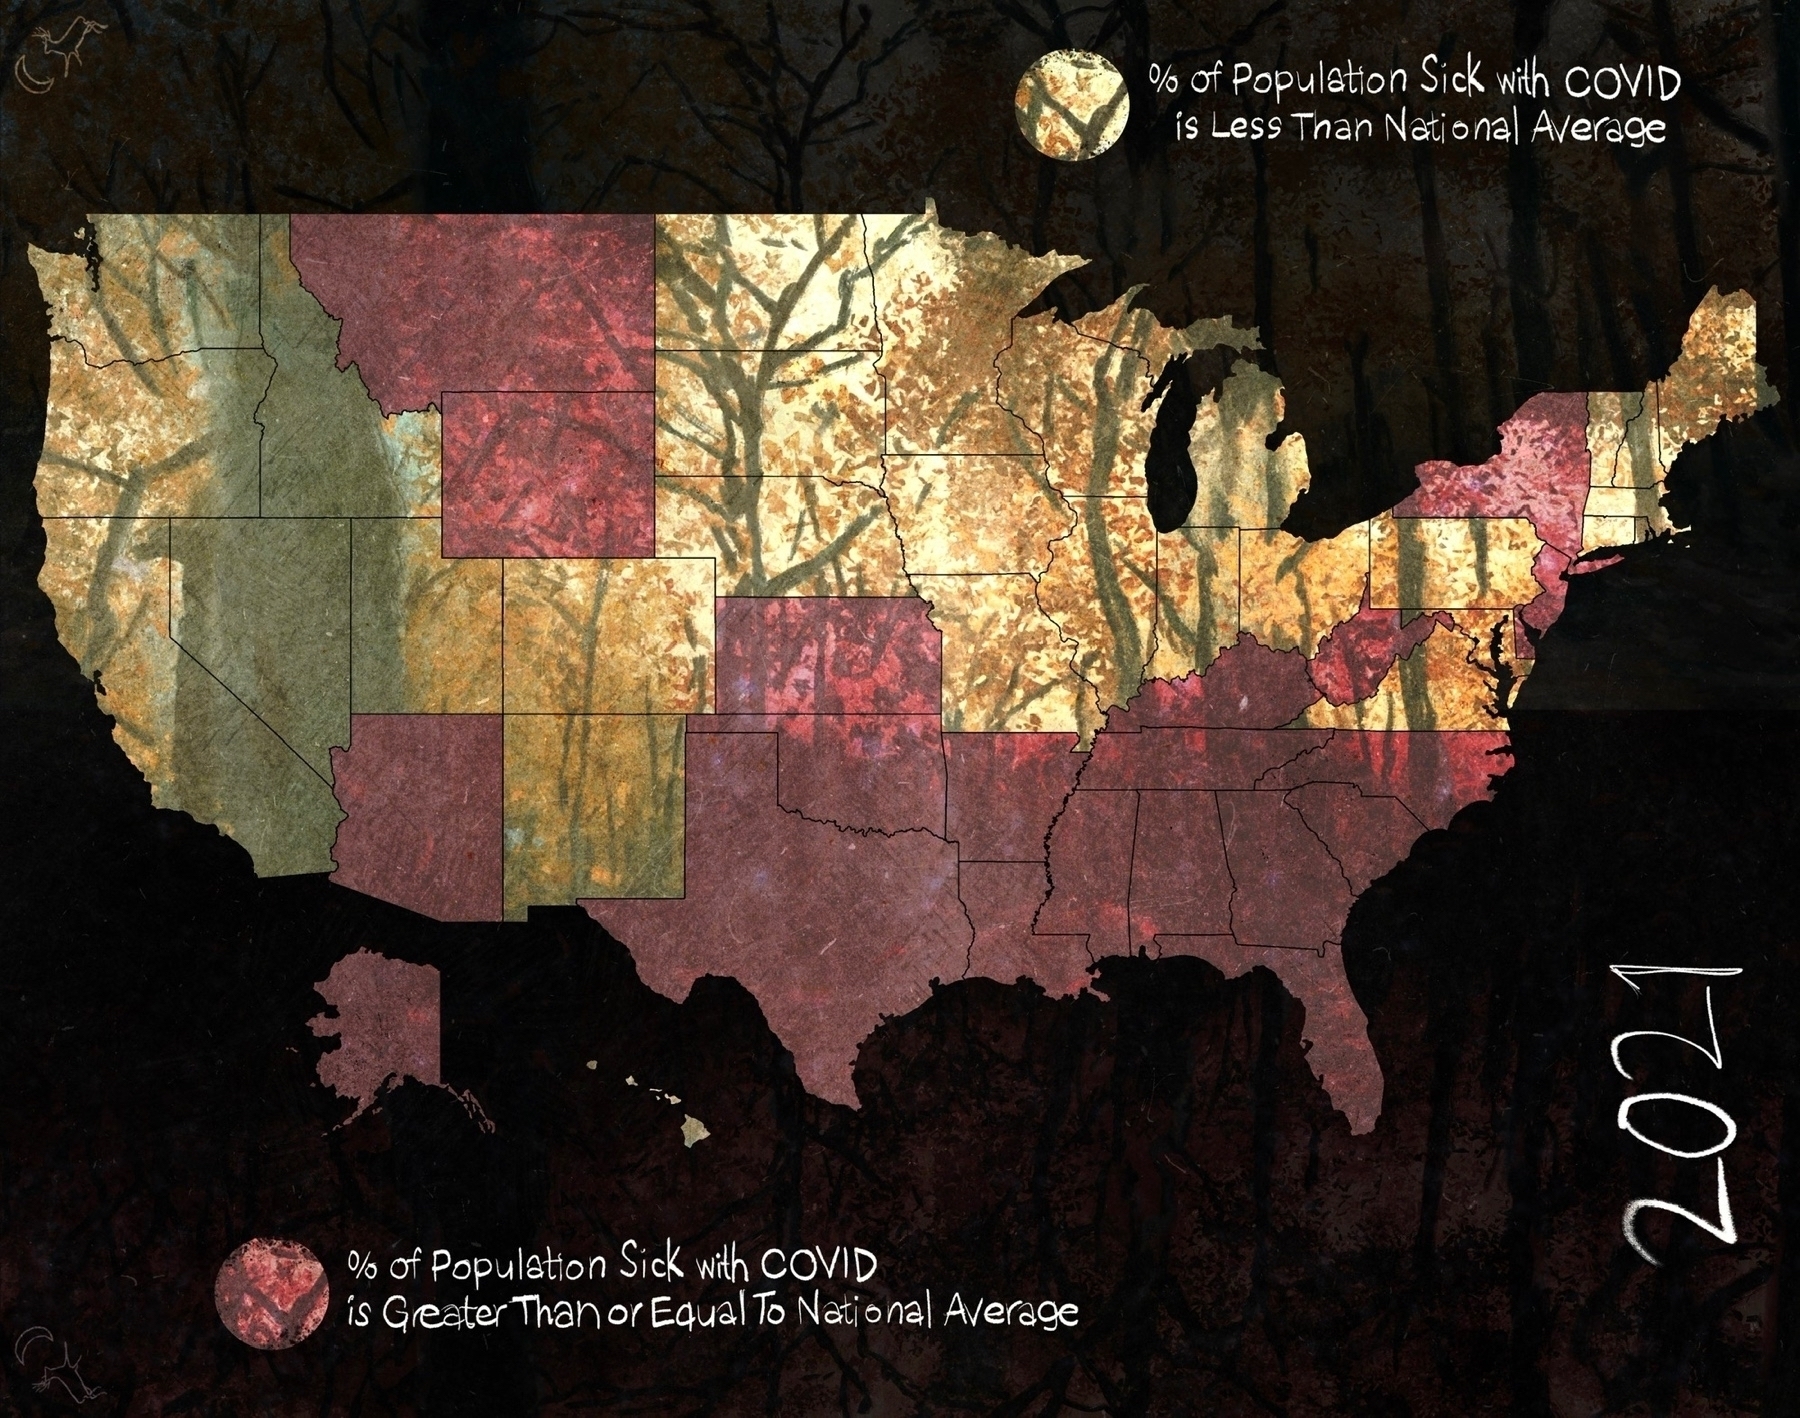
2021 #COVID cases
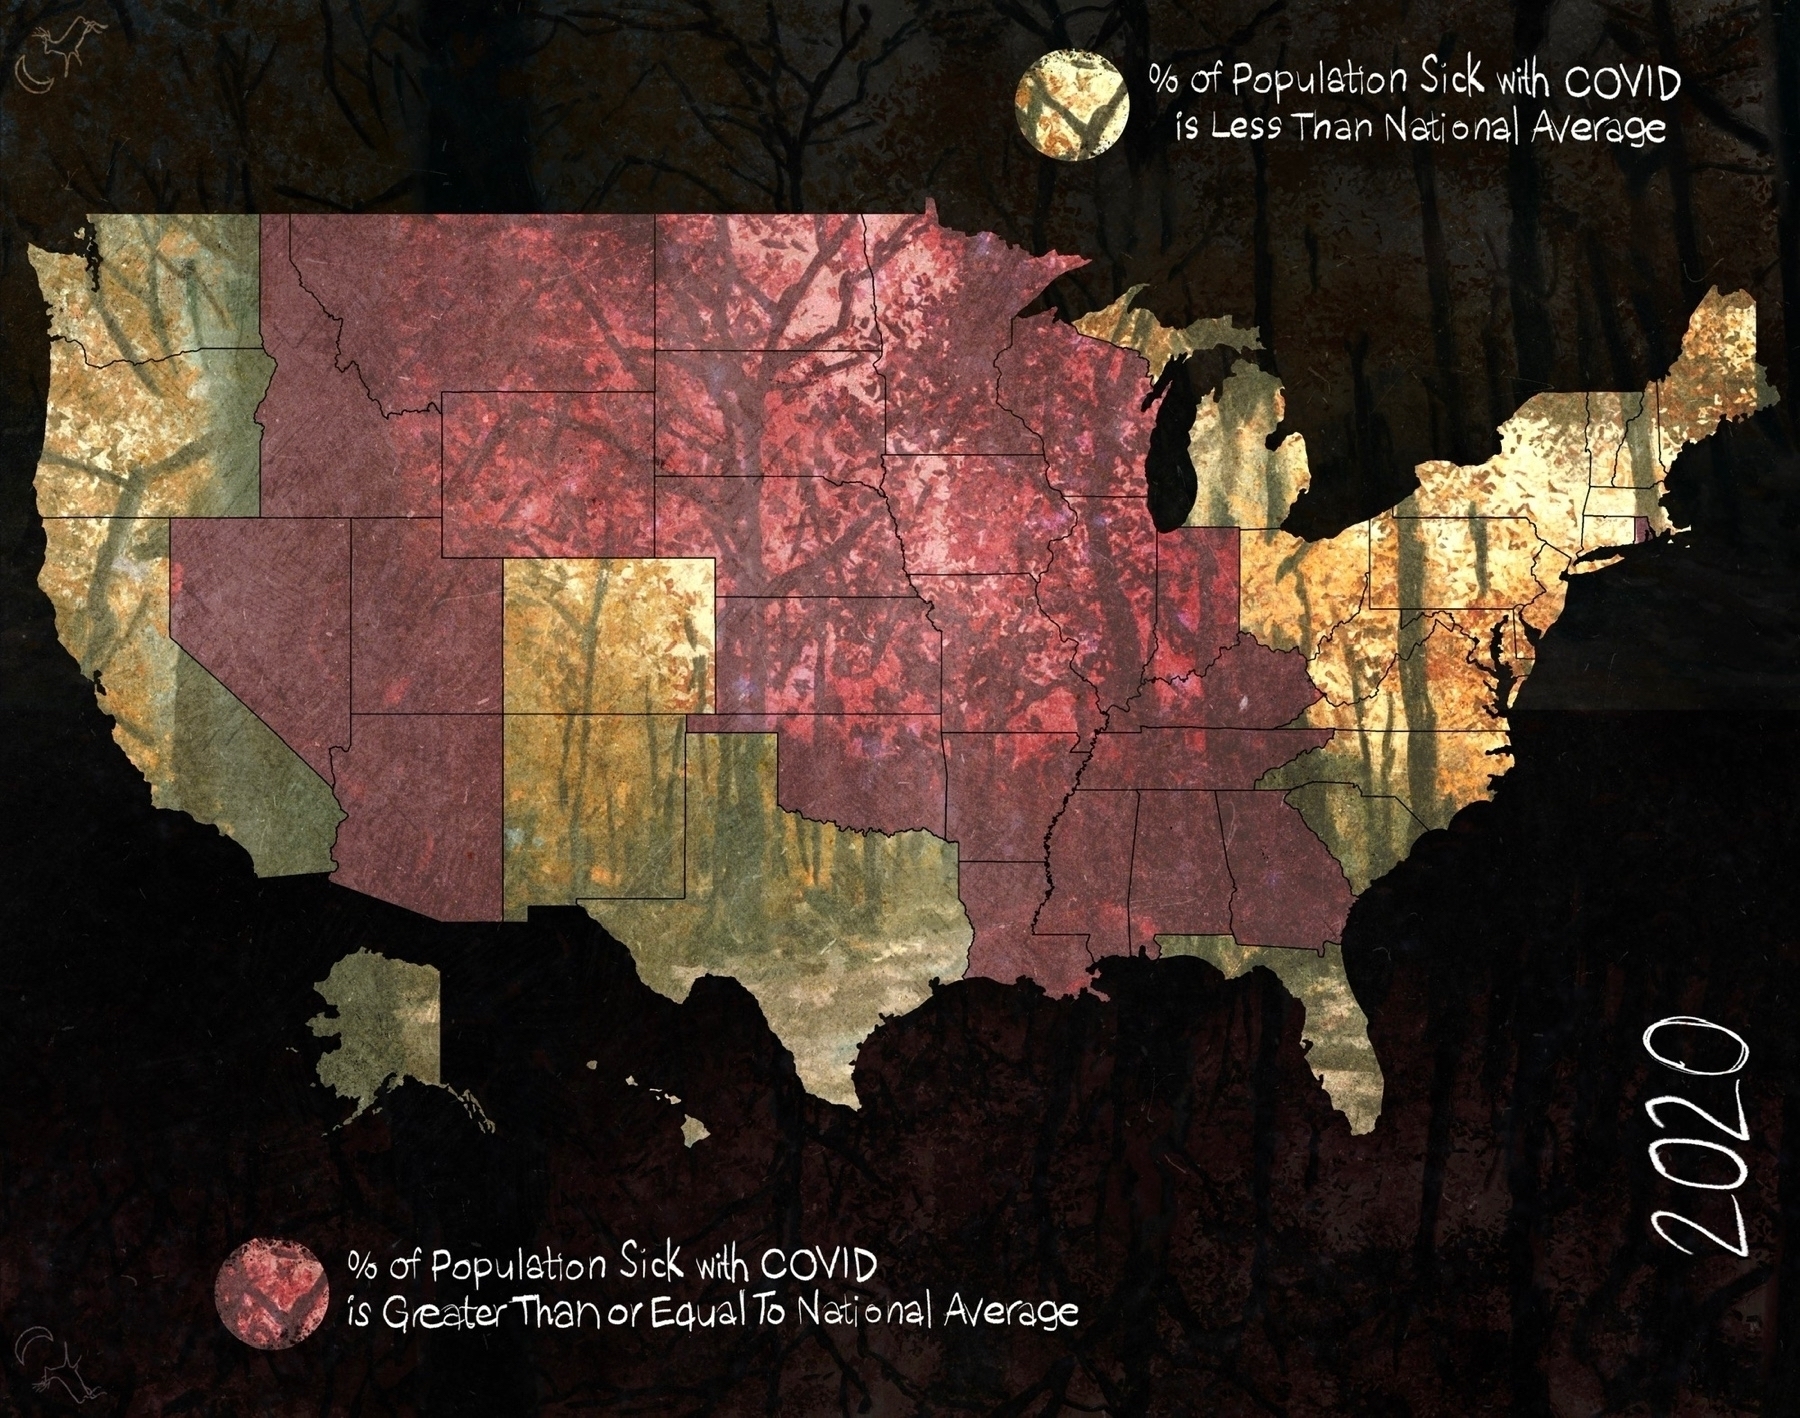
2020 #COVID cases
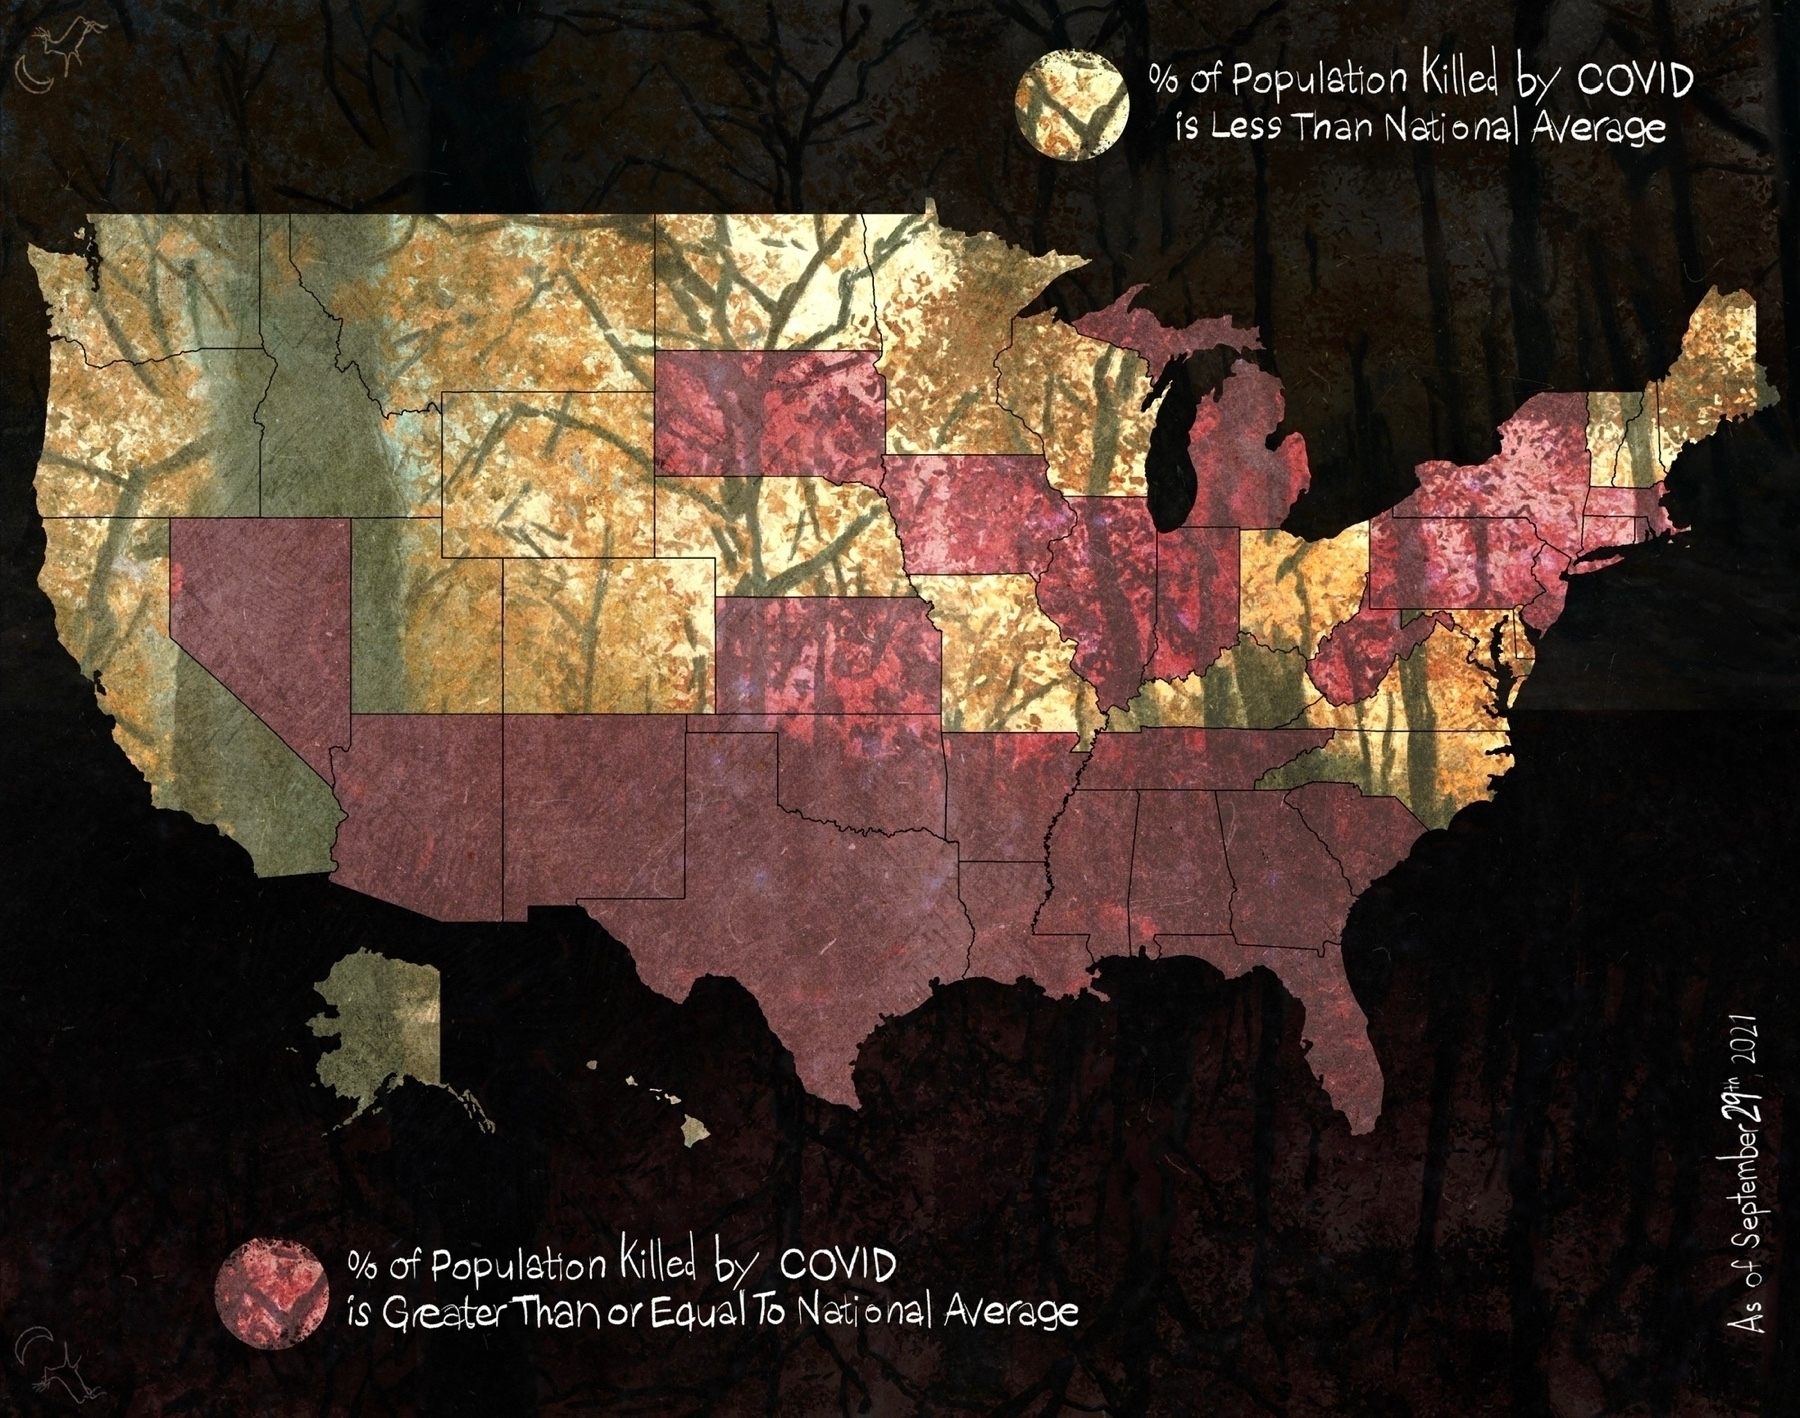
Total #COVID deaths
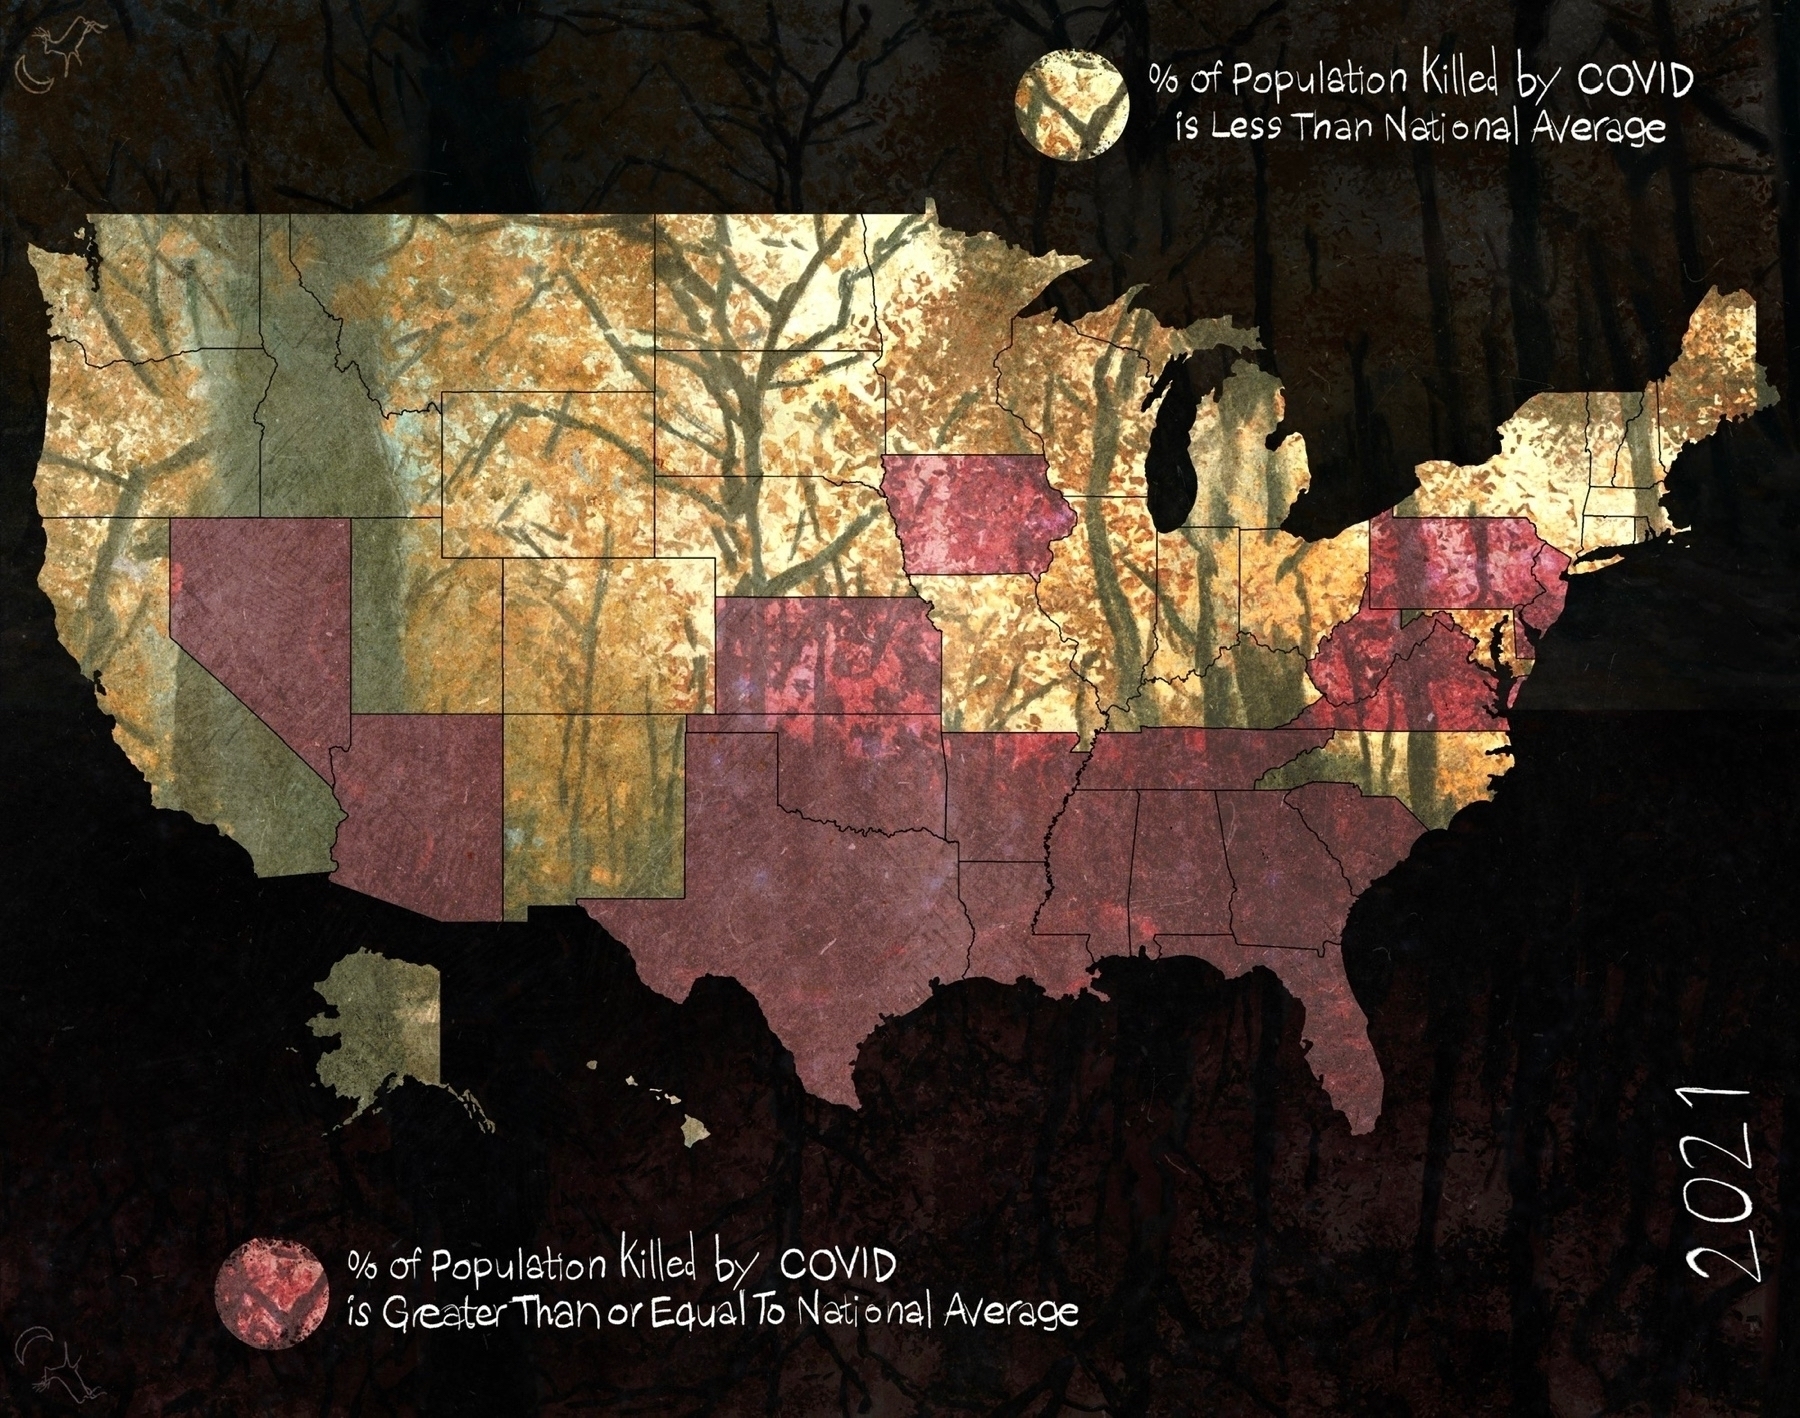
2021 #COVID deaths
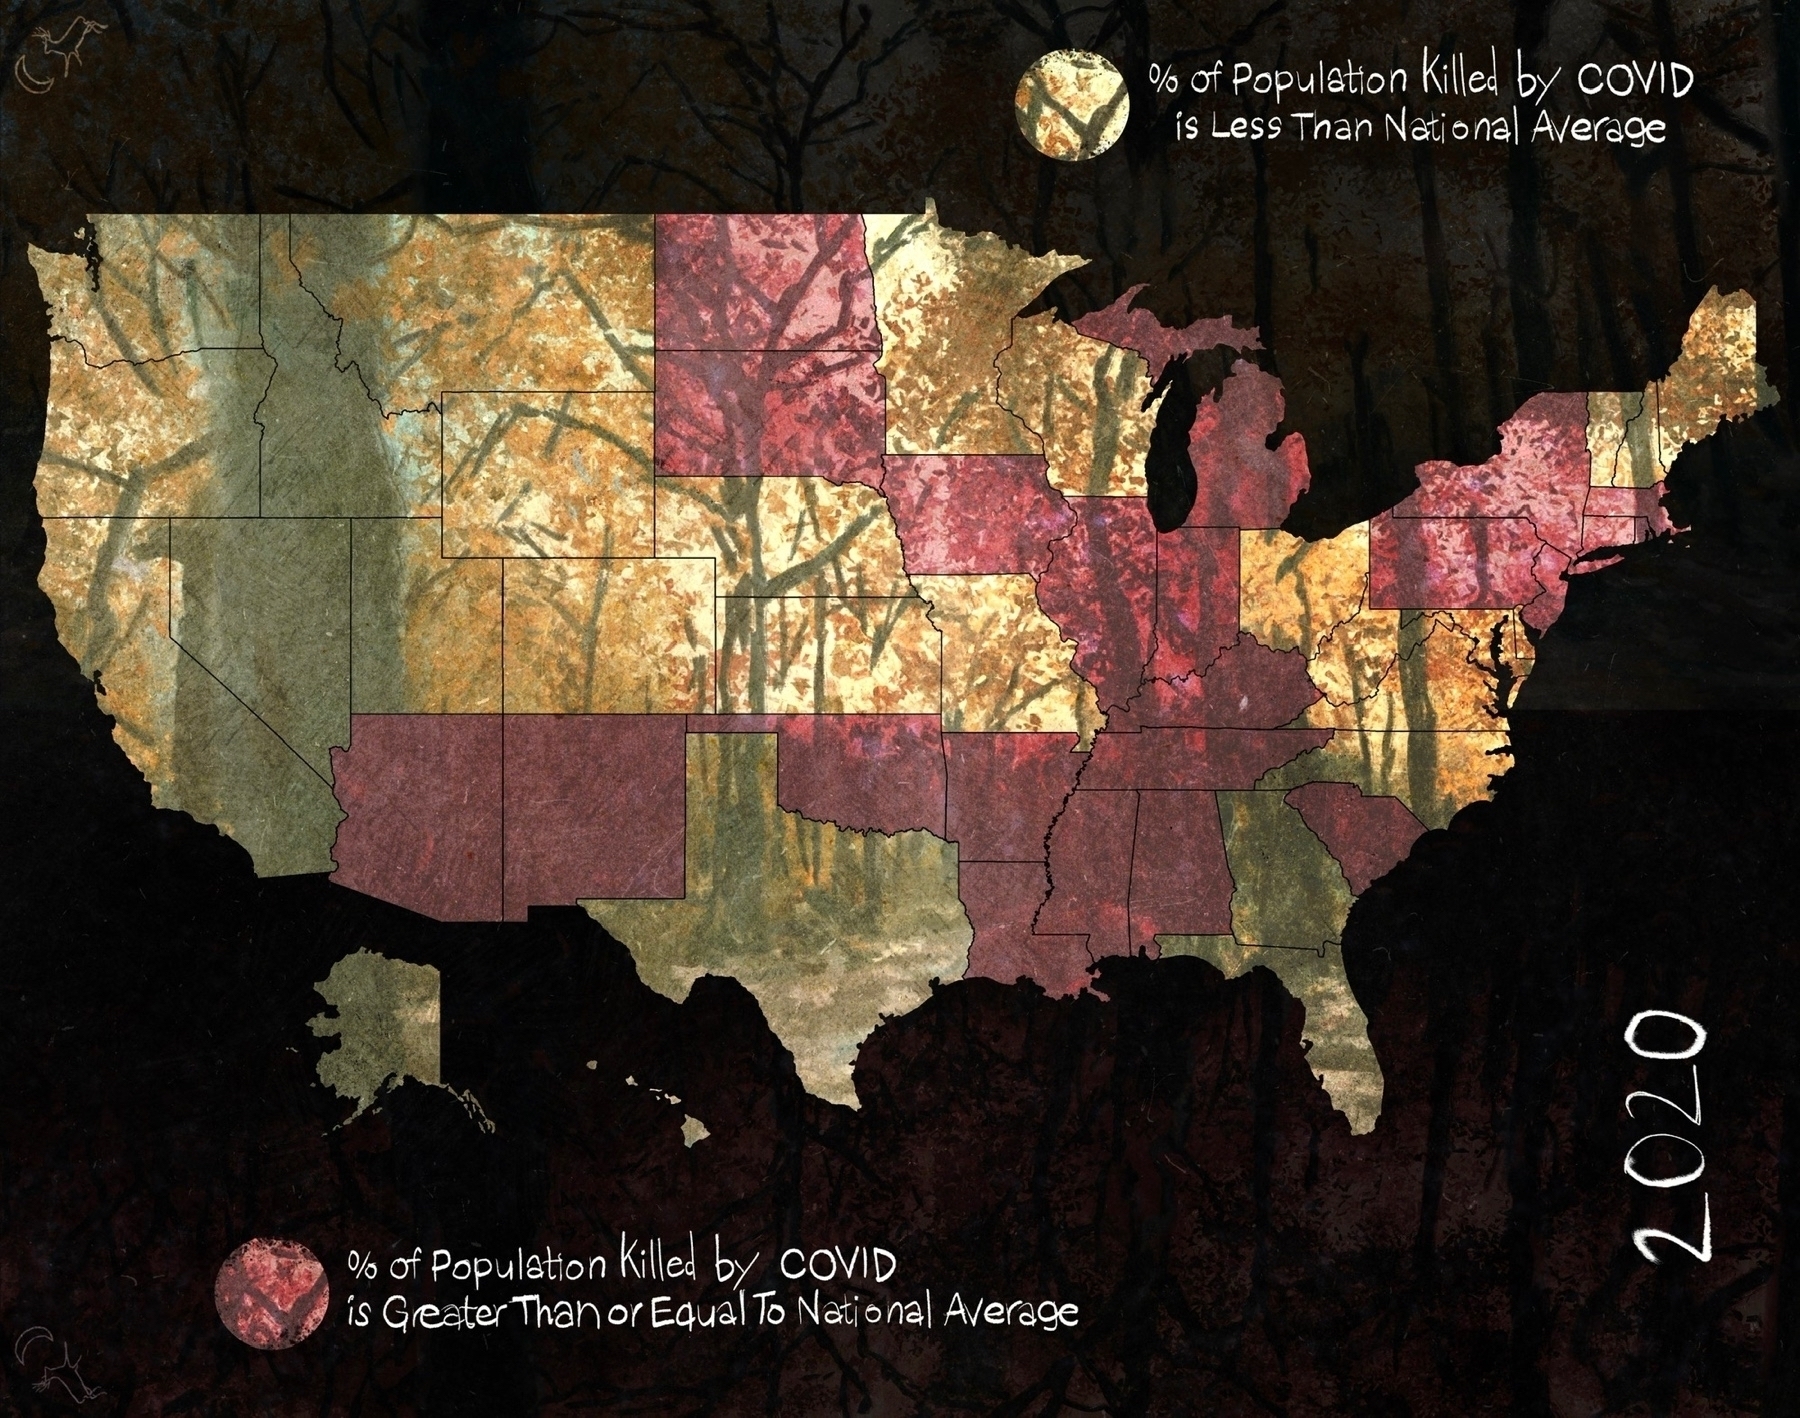
2020 #COVID deaths
Some updated cumulative #COVID maps

% of population killed ÷ by % of population getting sick by state by month since March 2020. The national average fluctuates between 1.5% and 5%. Dips to 0.94% last April. Rebounds in May & June. Then stays sub 1% for the last 3 months.
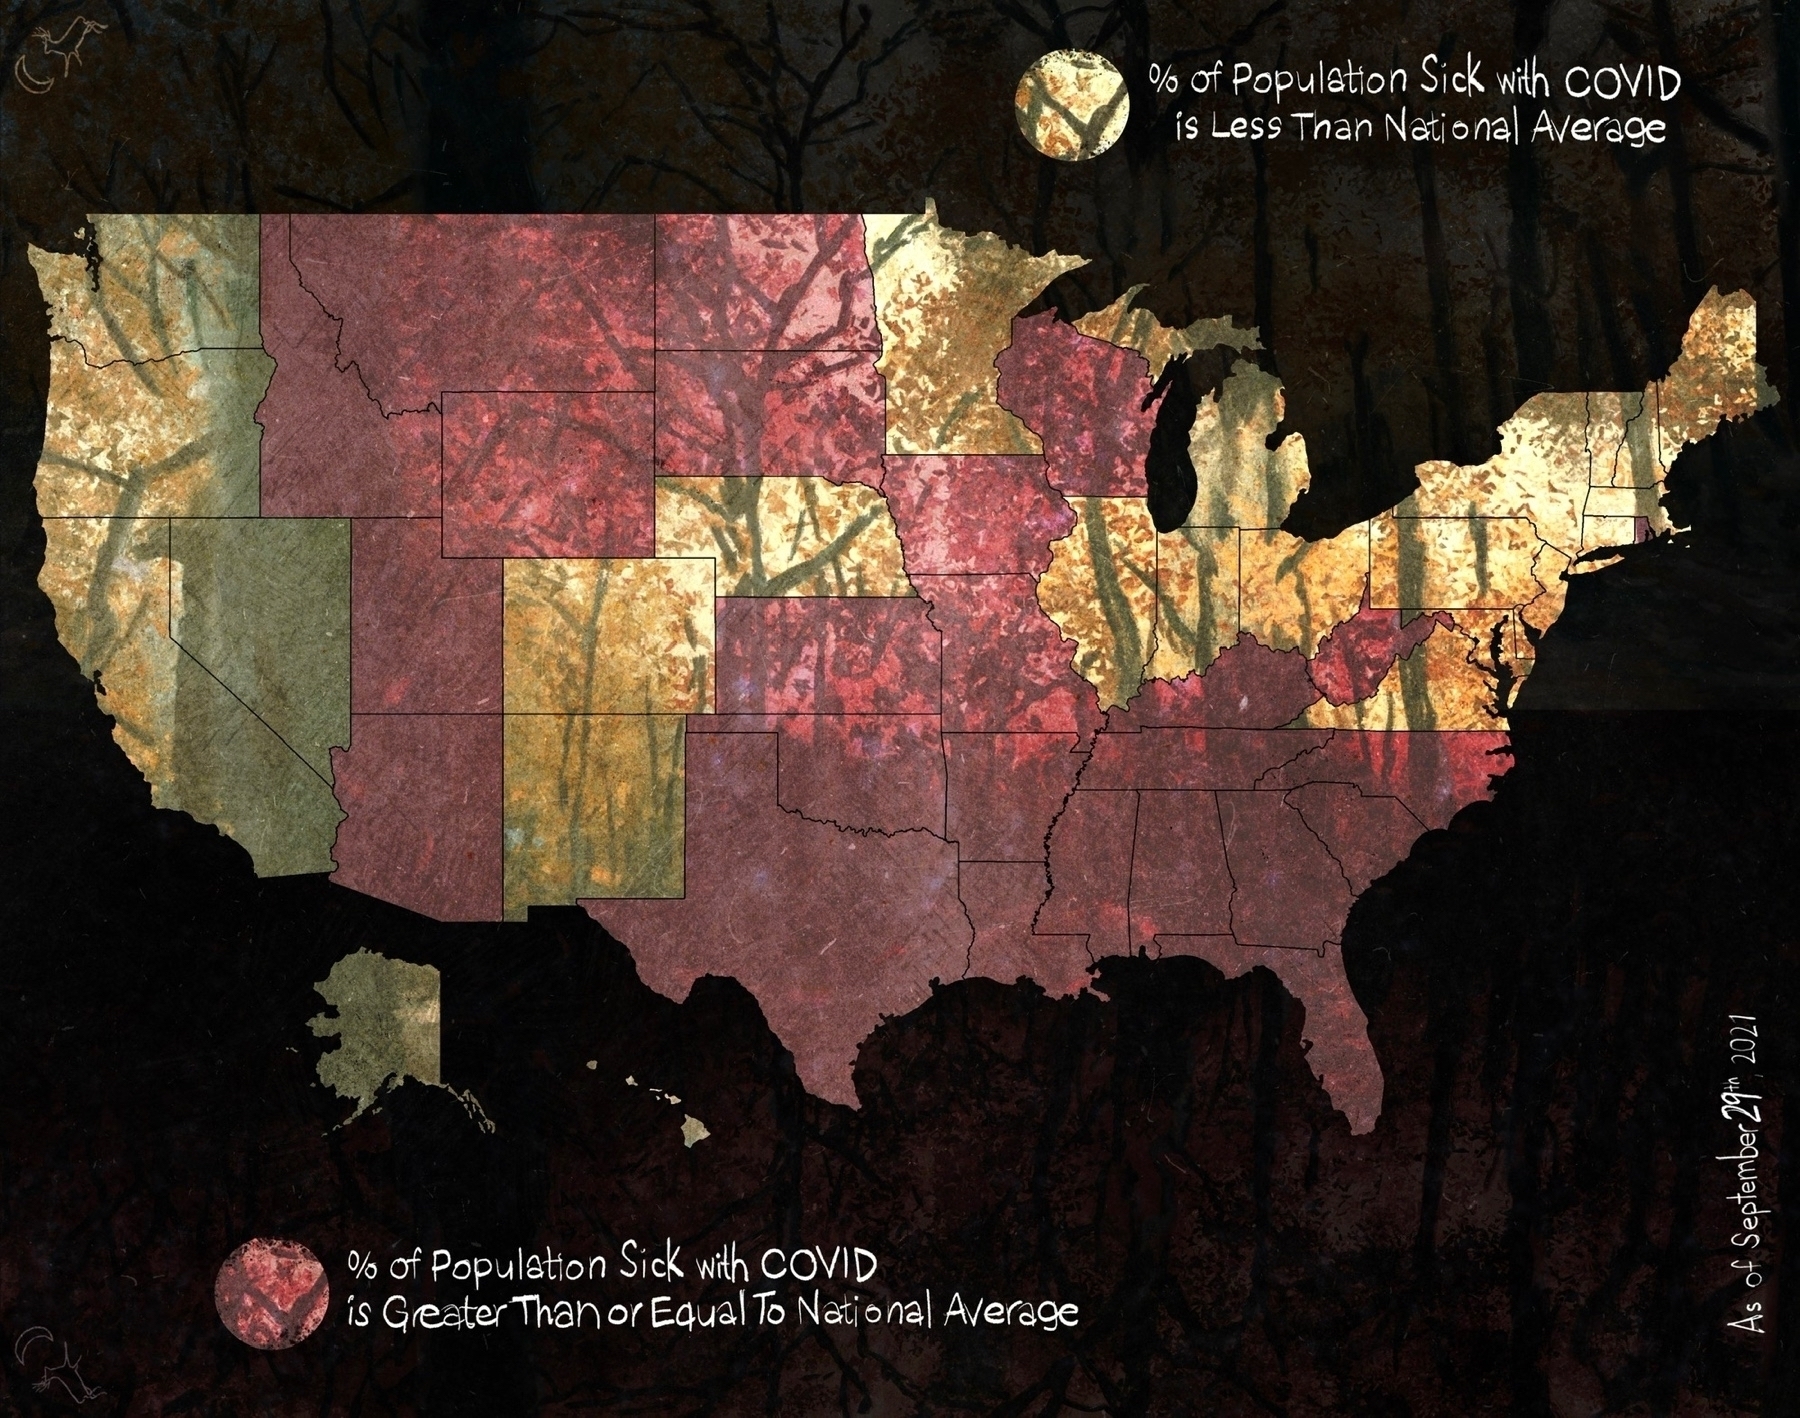
Percent population sick with COVID by state by month since March 2020
Percent population killed by COVID by state by month since March 2020
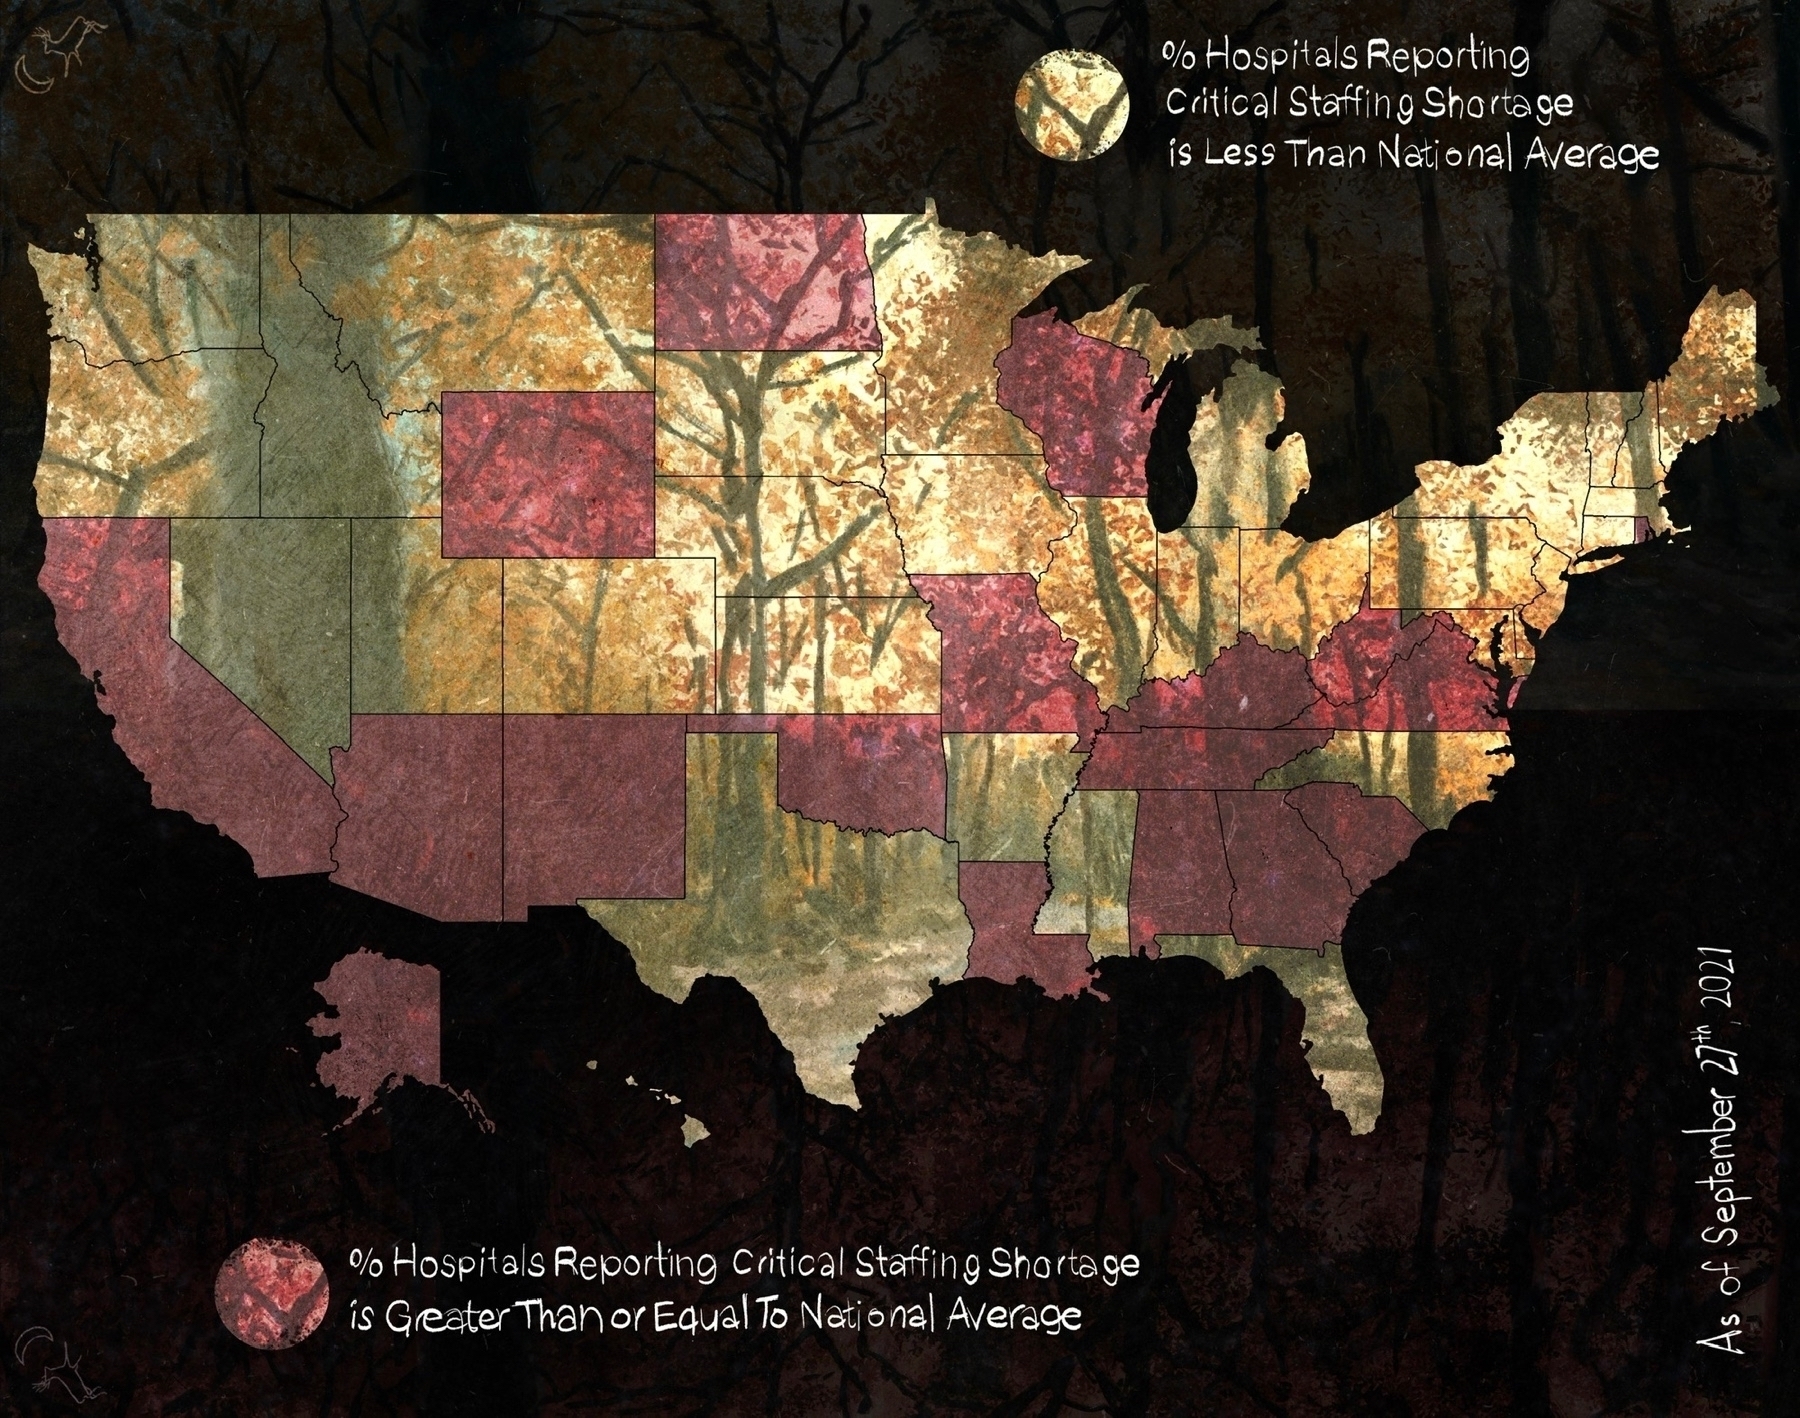
Hospitals reporting critical staffing shortage by state
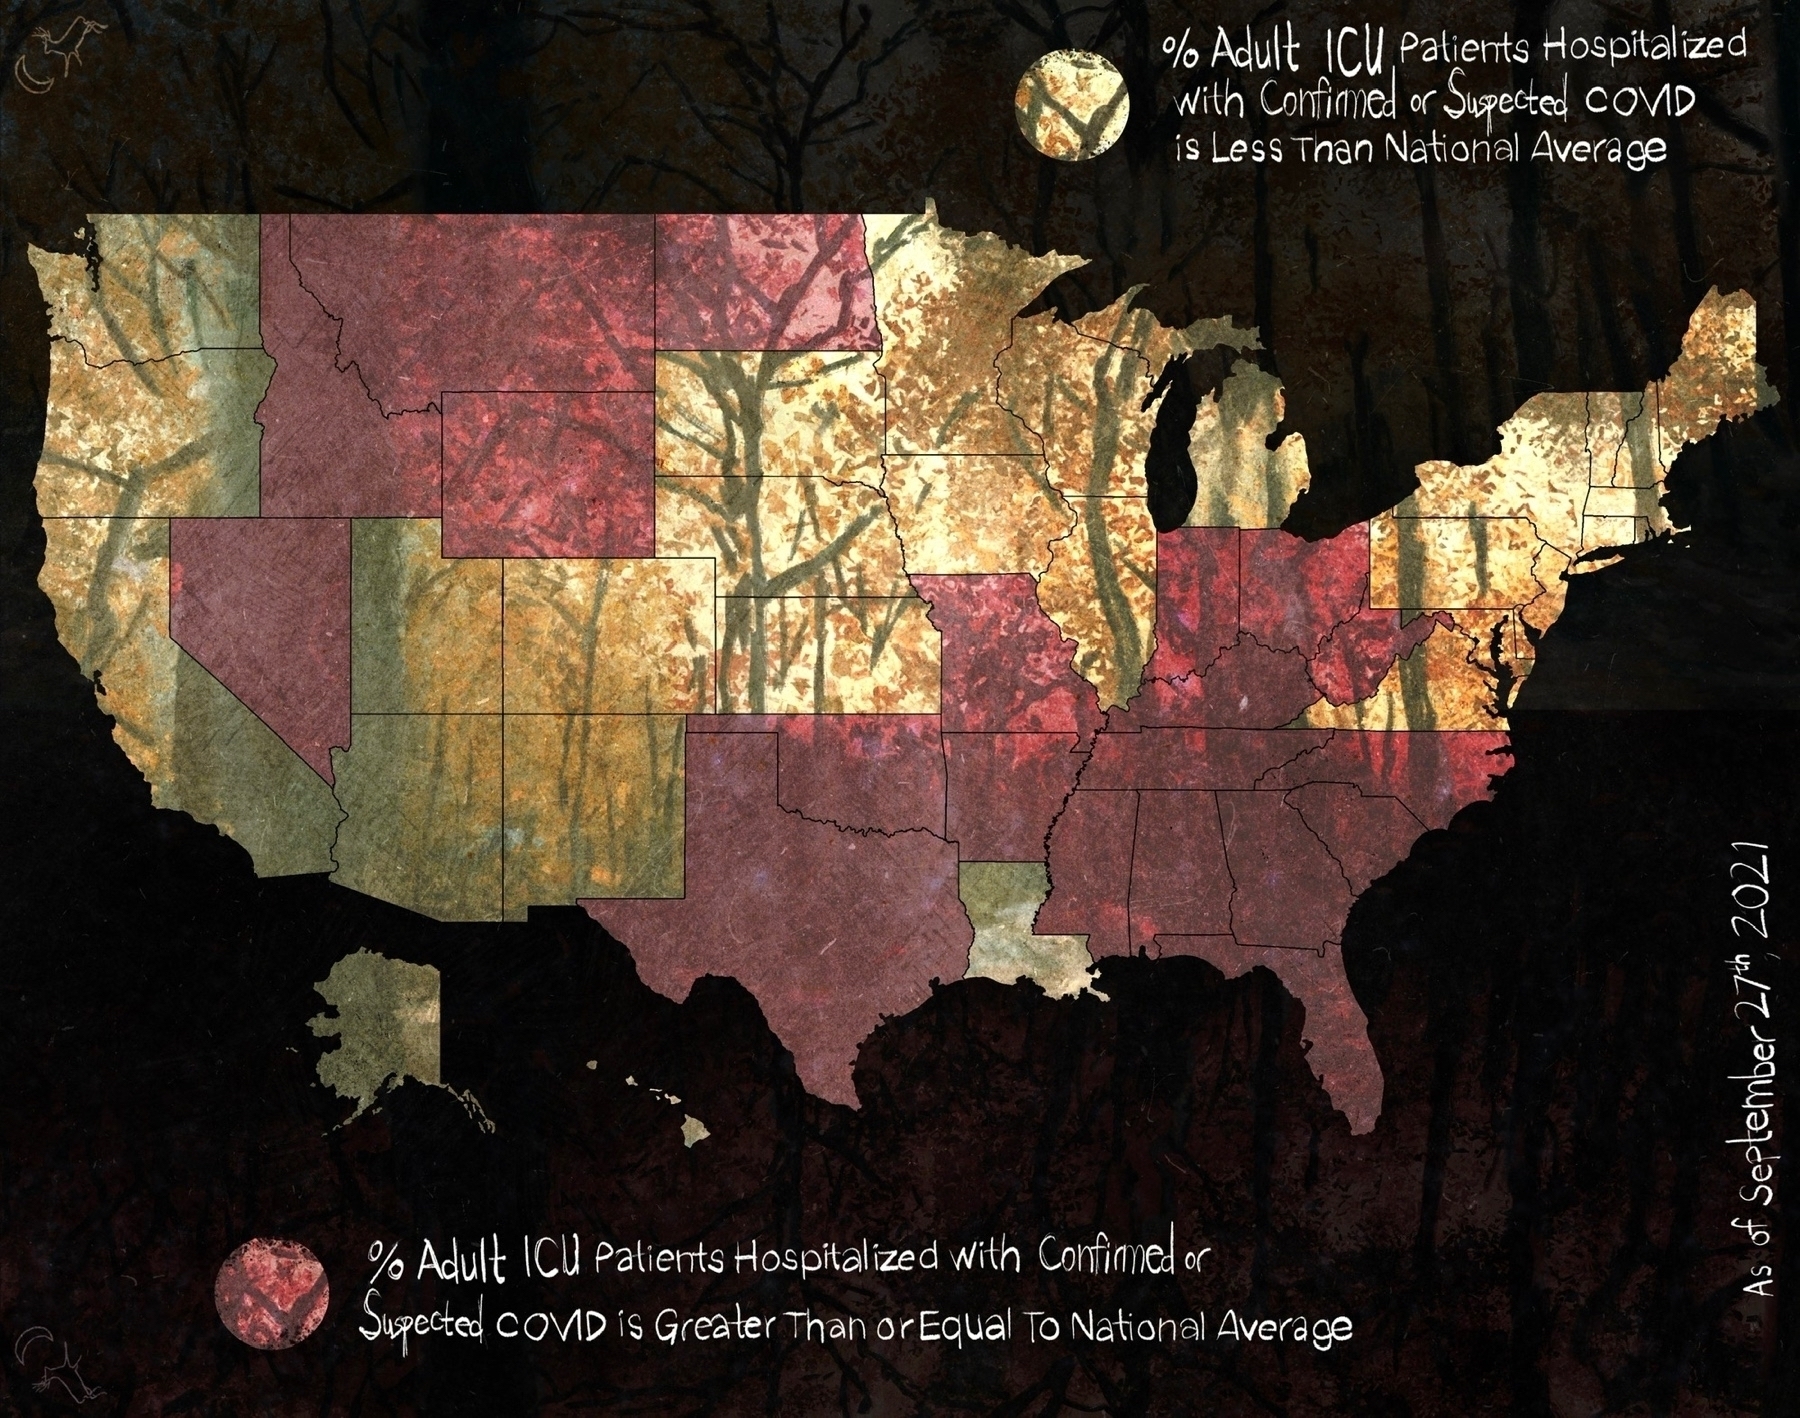
Percent of adult population in the ICU with confirmed or suspected COVID by state
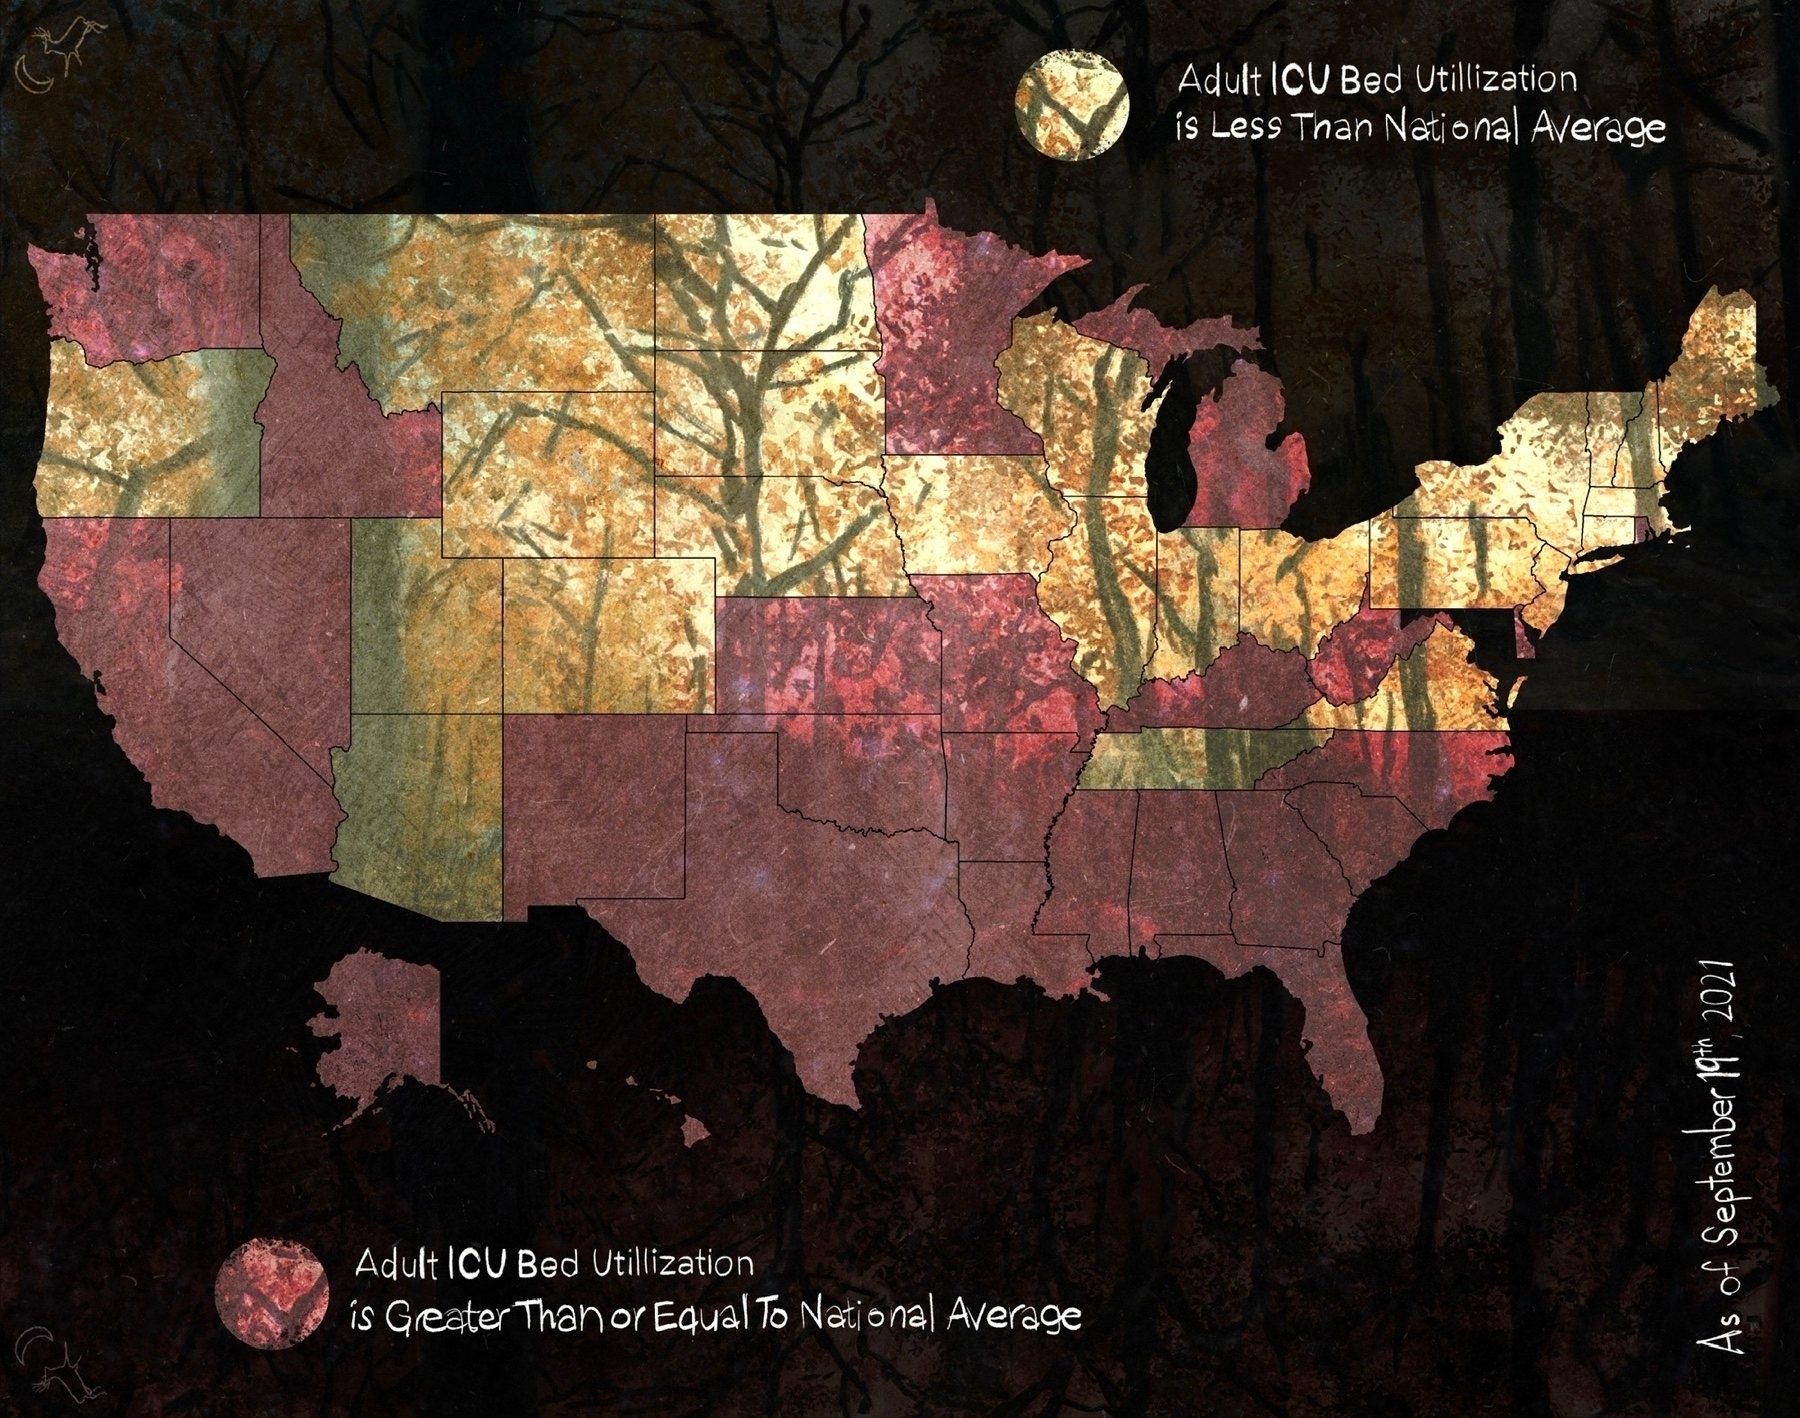
Adult ICU bed COVID utilization by state

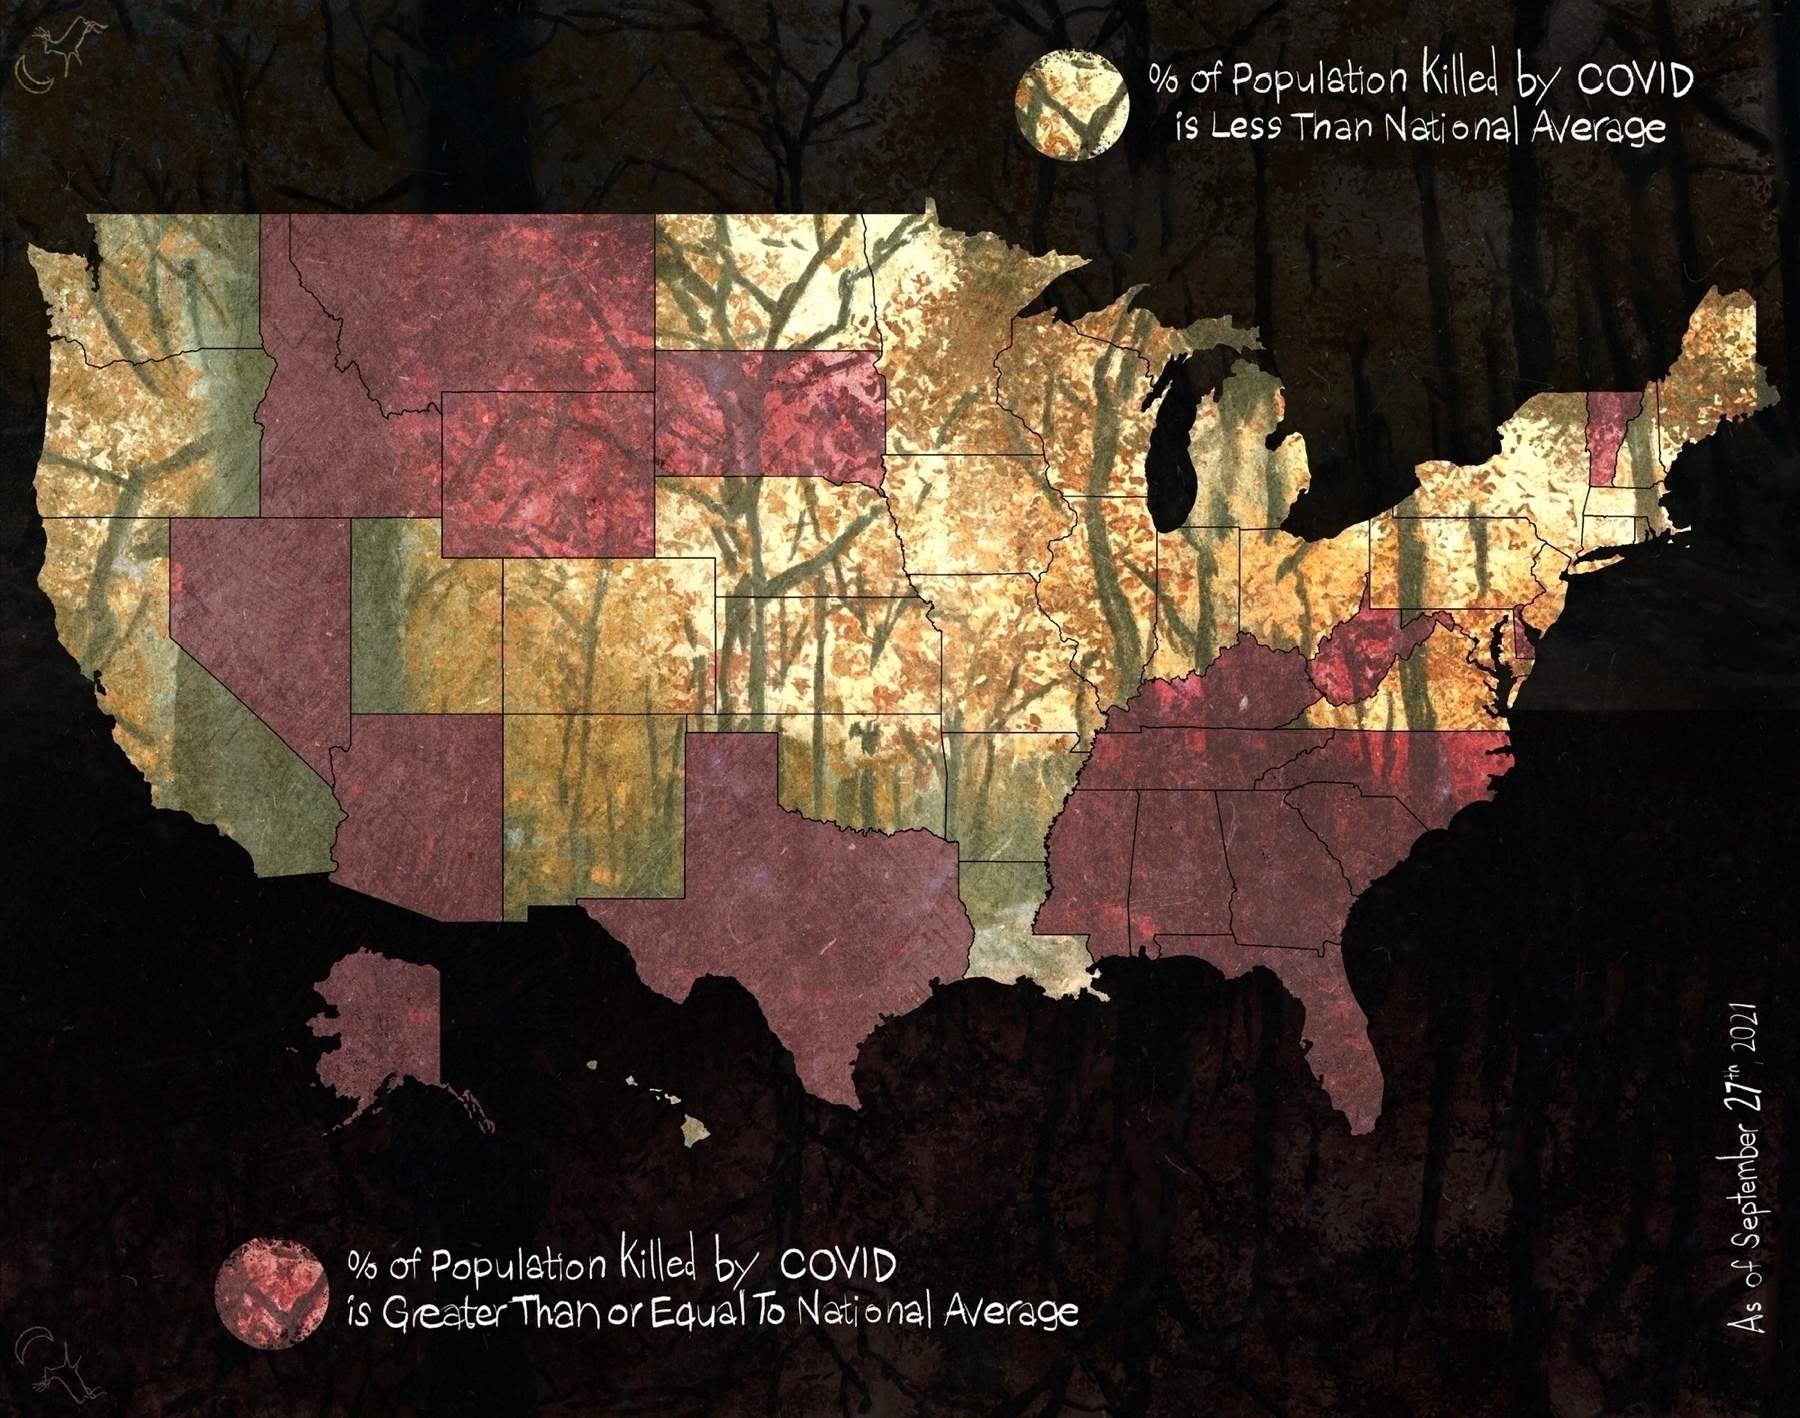
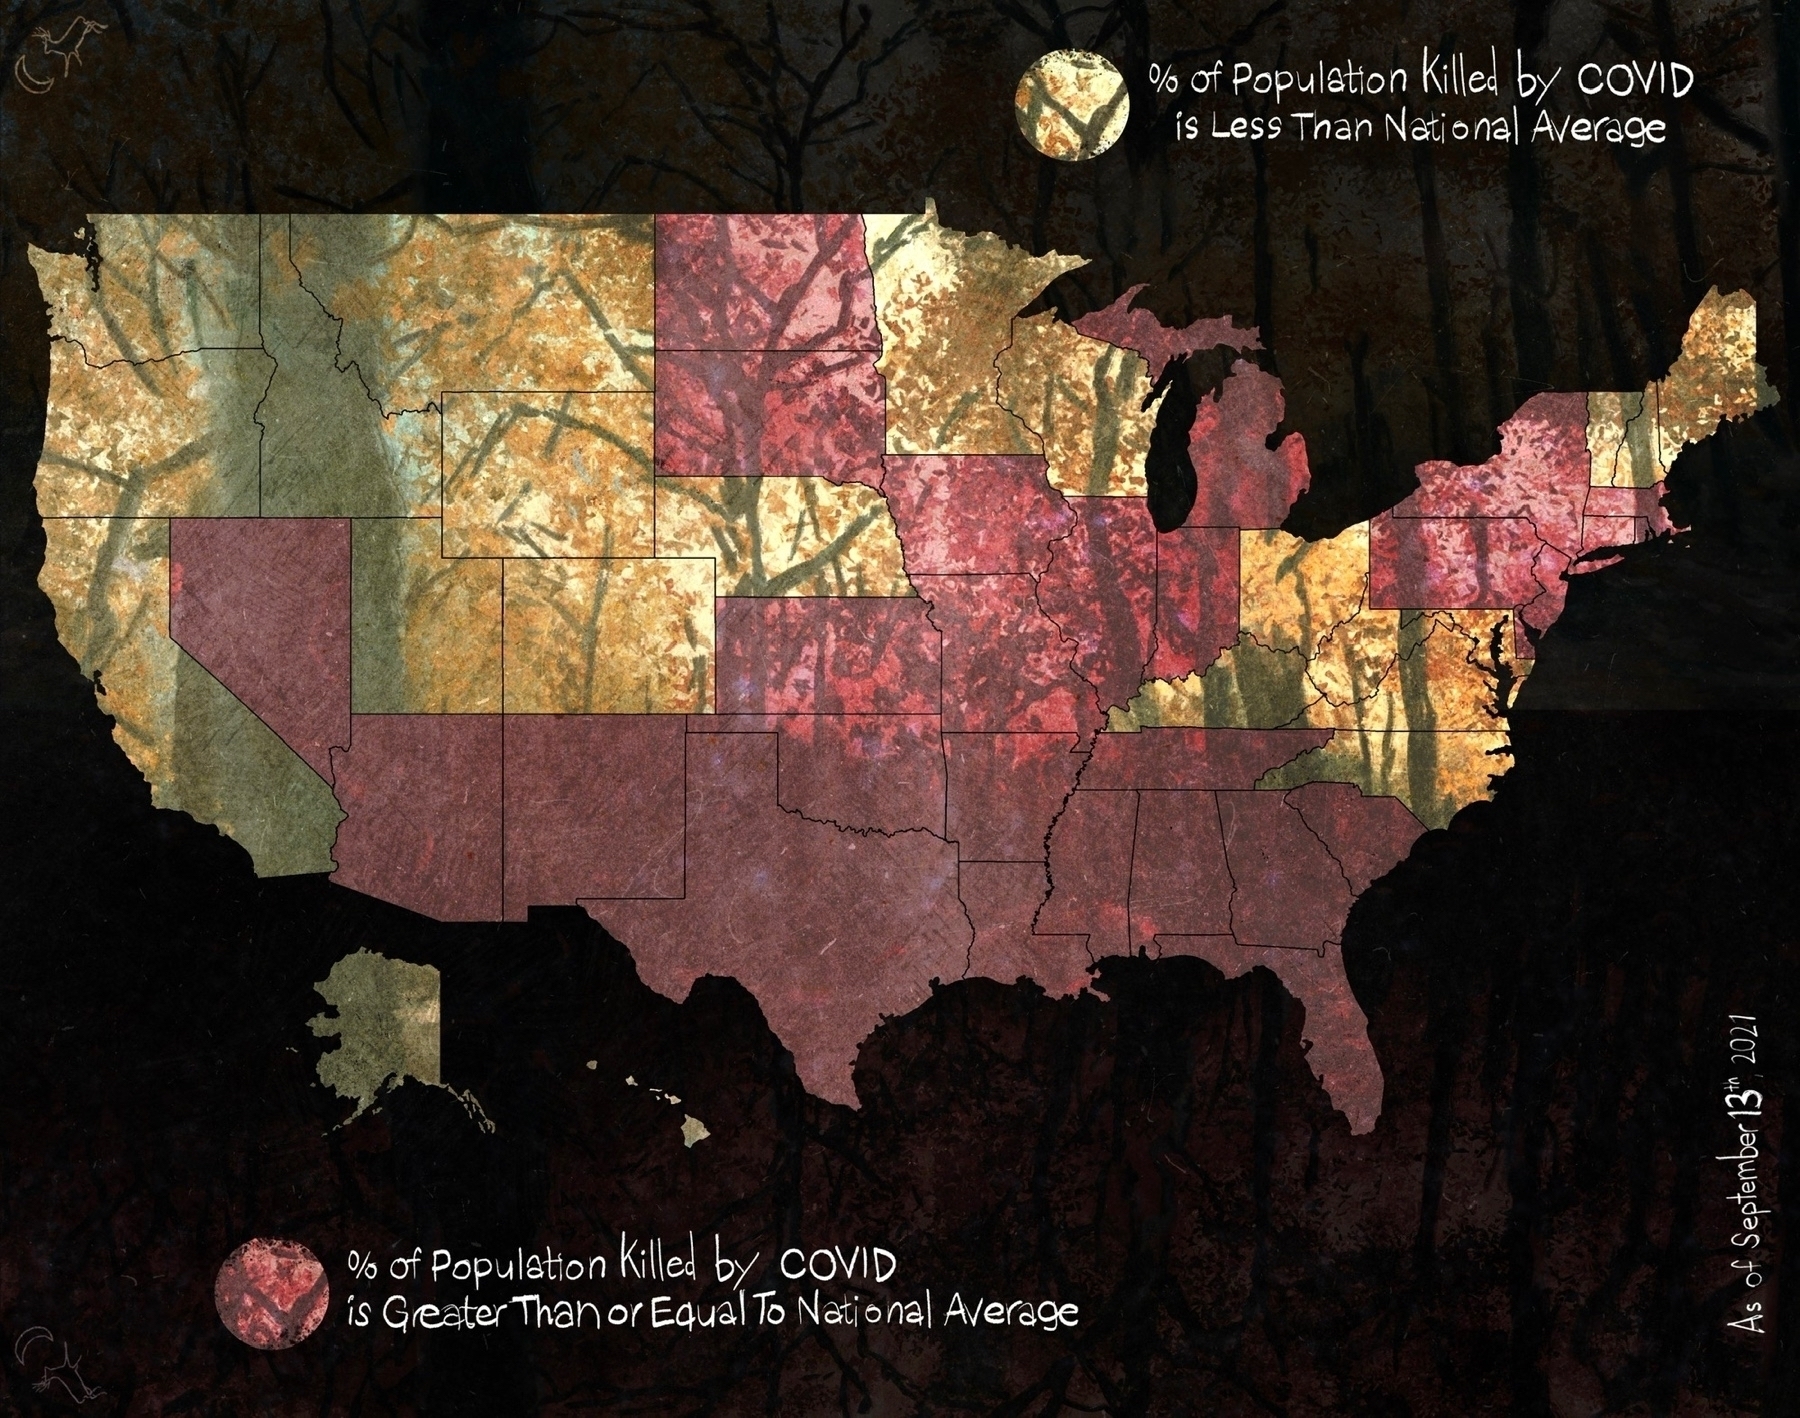
Percent of population killed by COVID by state
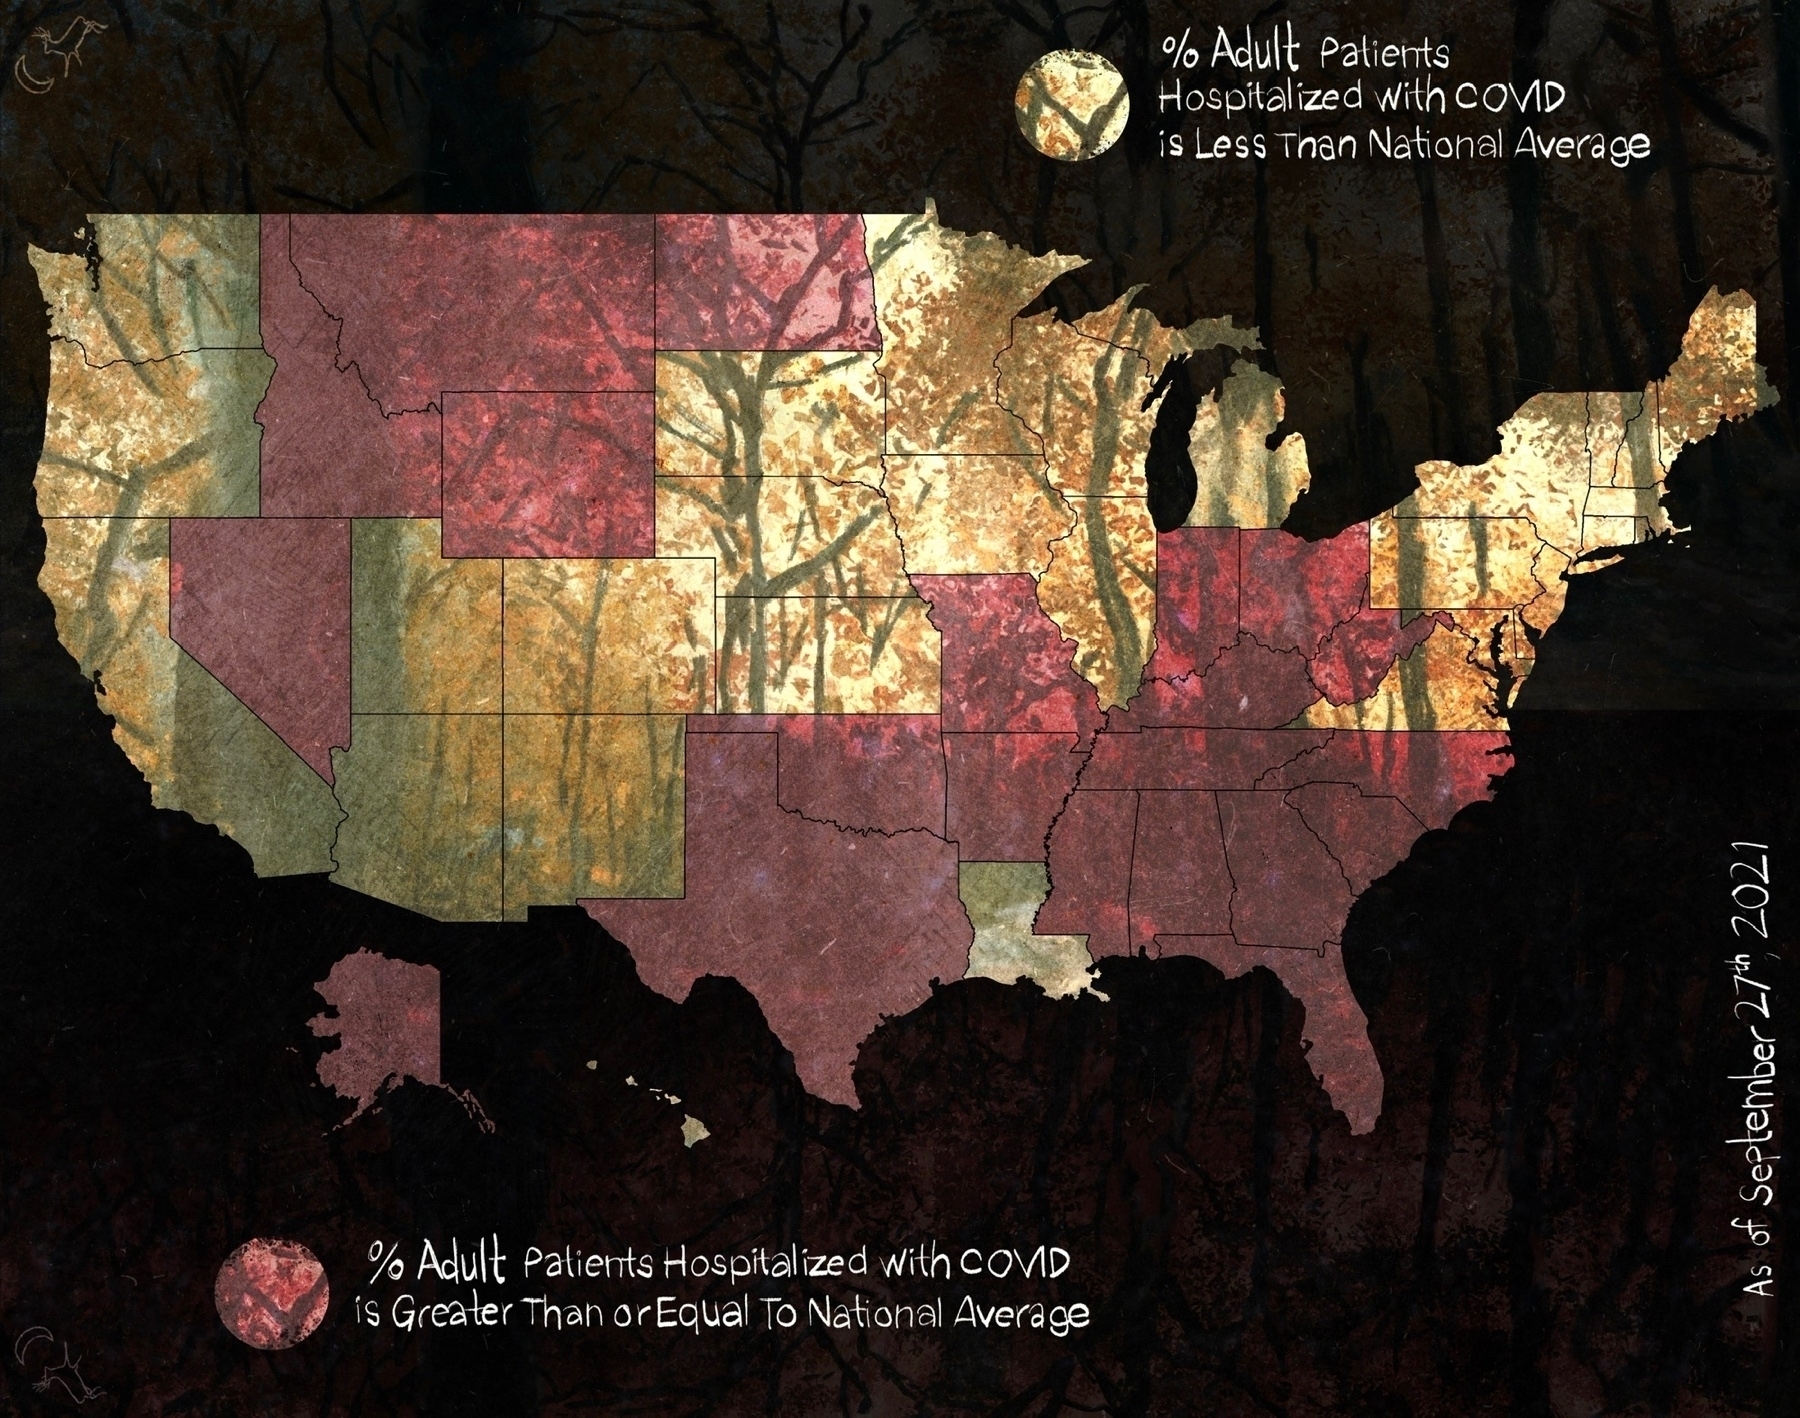
Adult COVID patient to population ratio by state
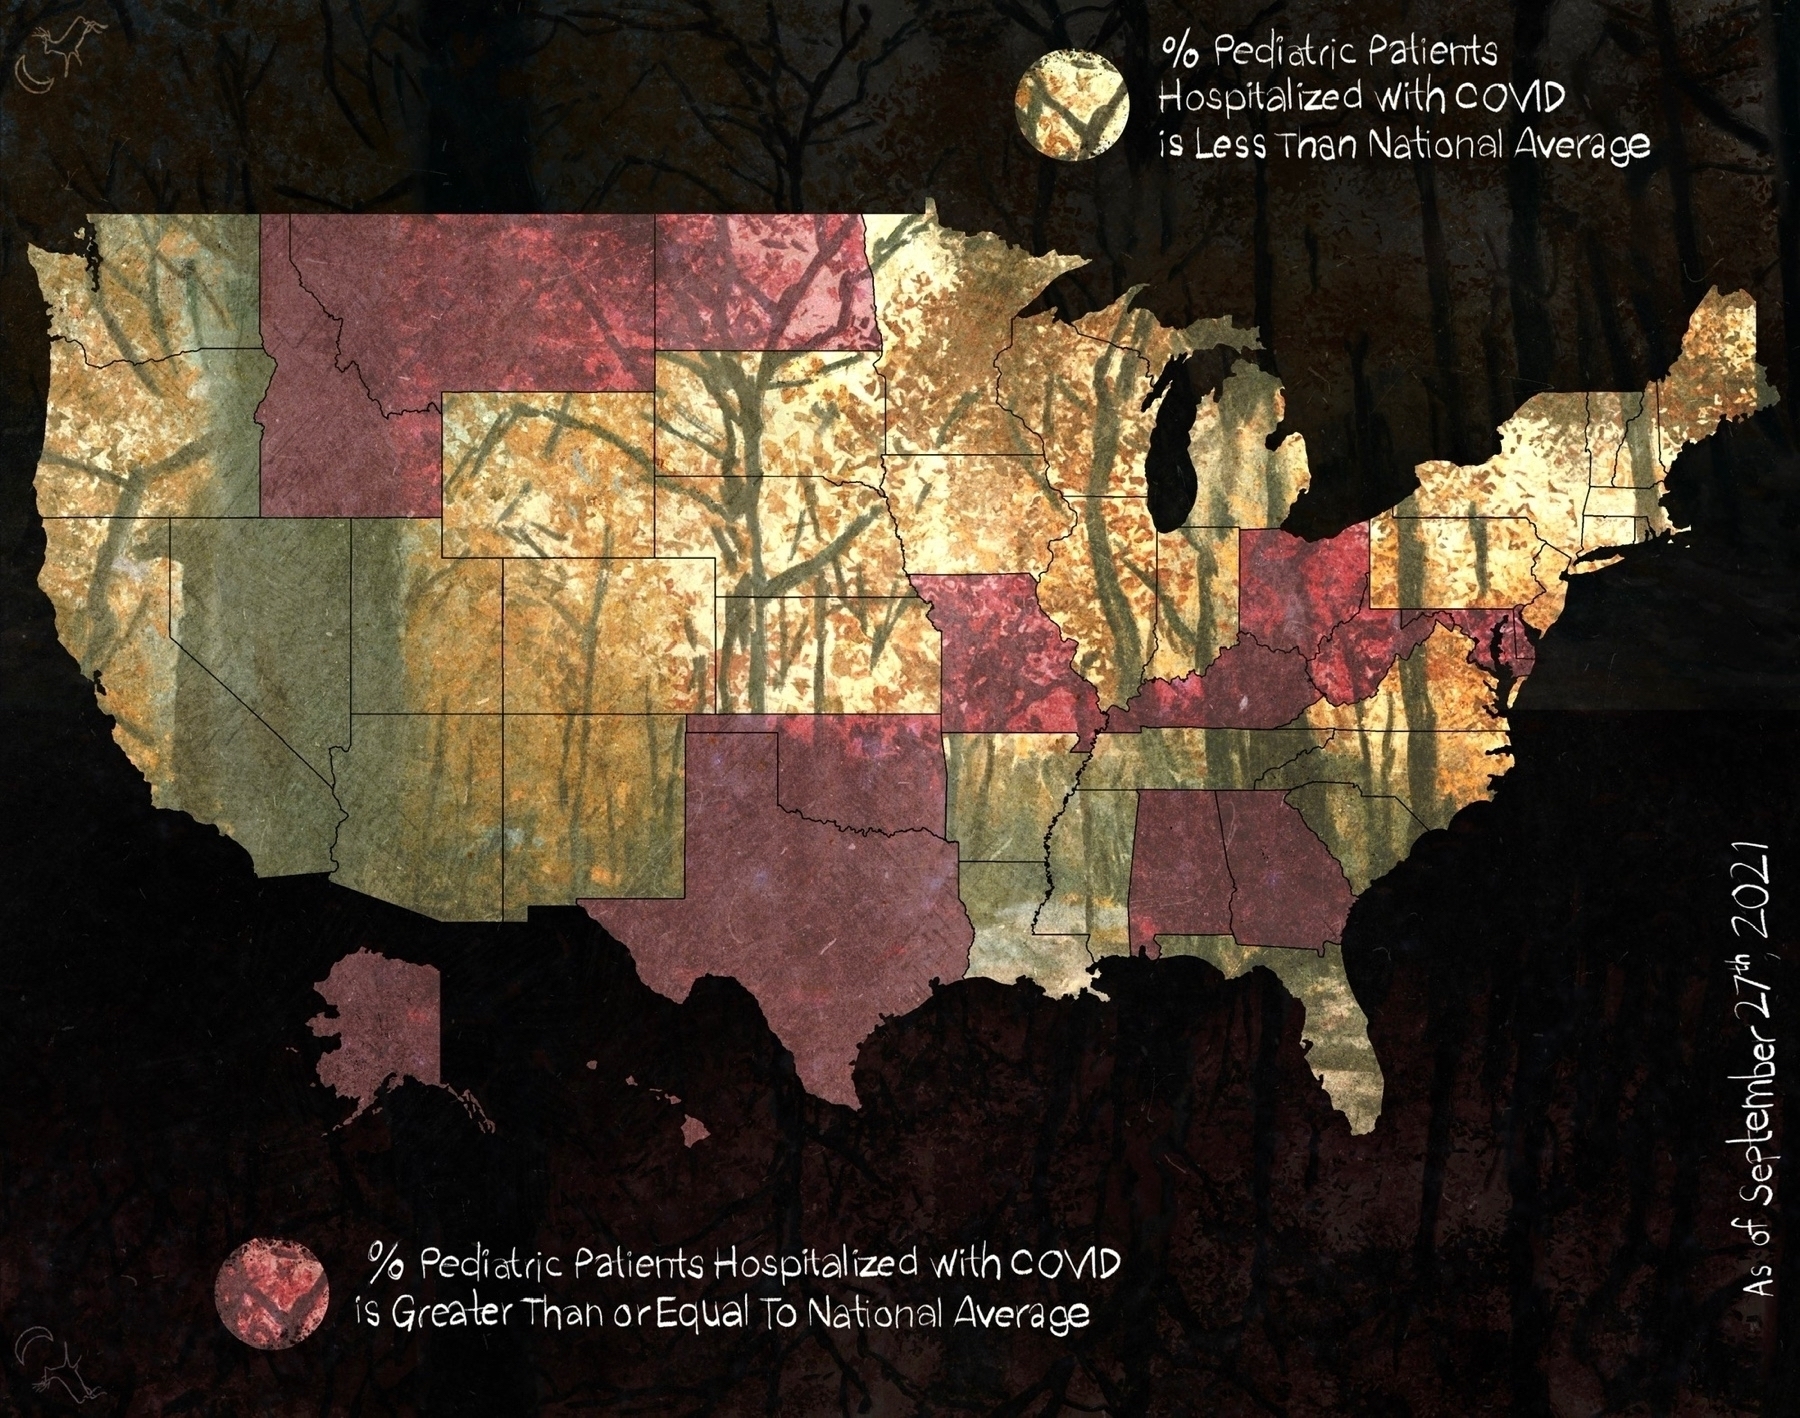
Pediatric COVID patient to population ratio by state
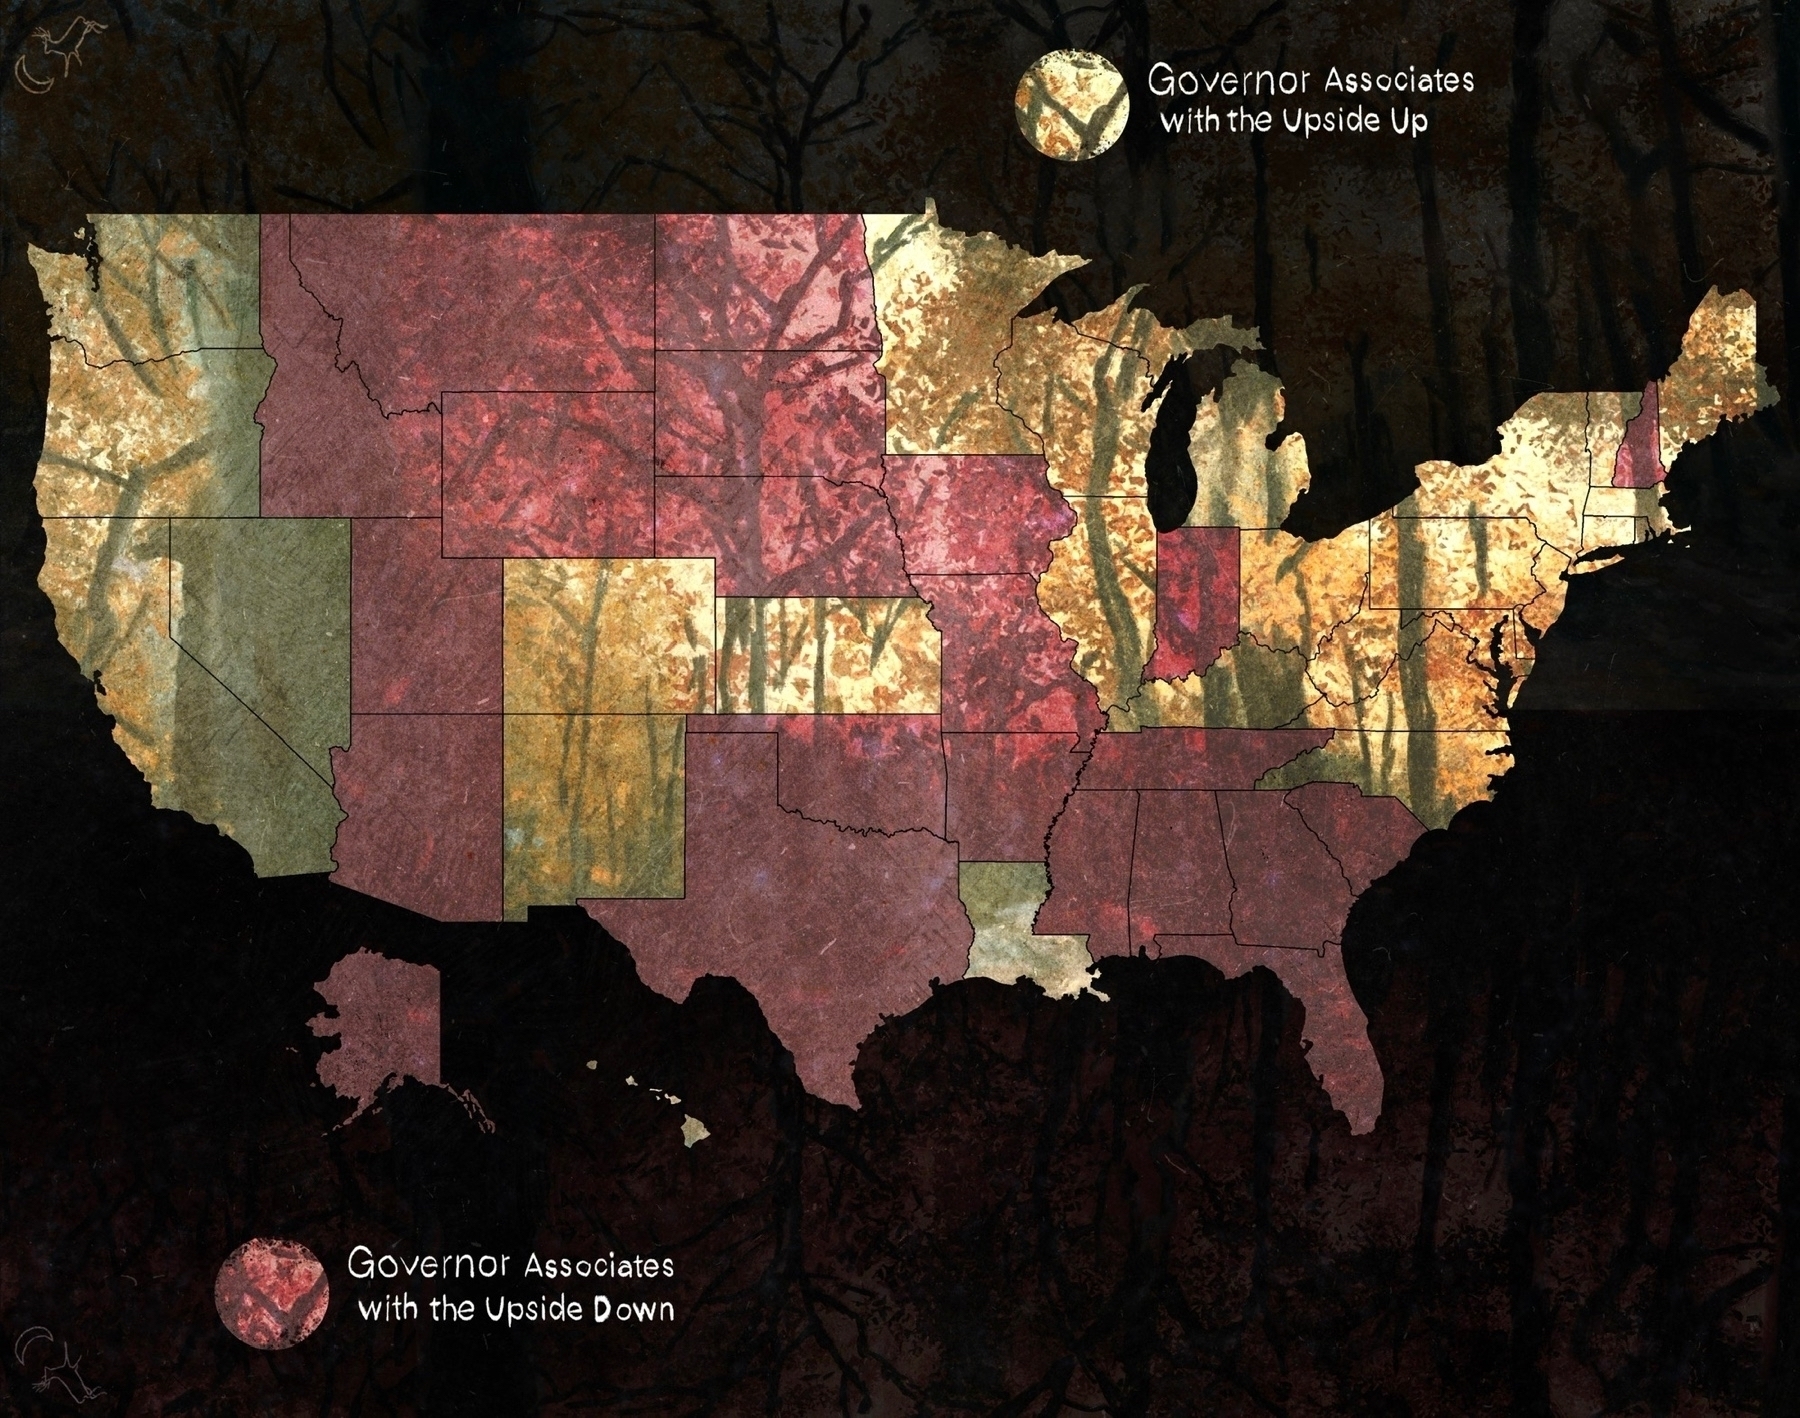
Governor reality associations at scale
ICU bed utilization by state at scale
% killed by COVID by state at scale
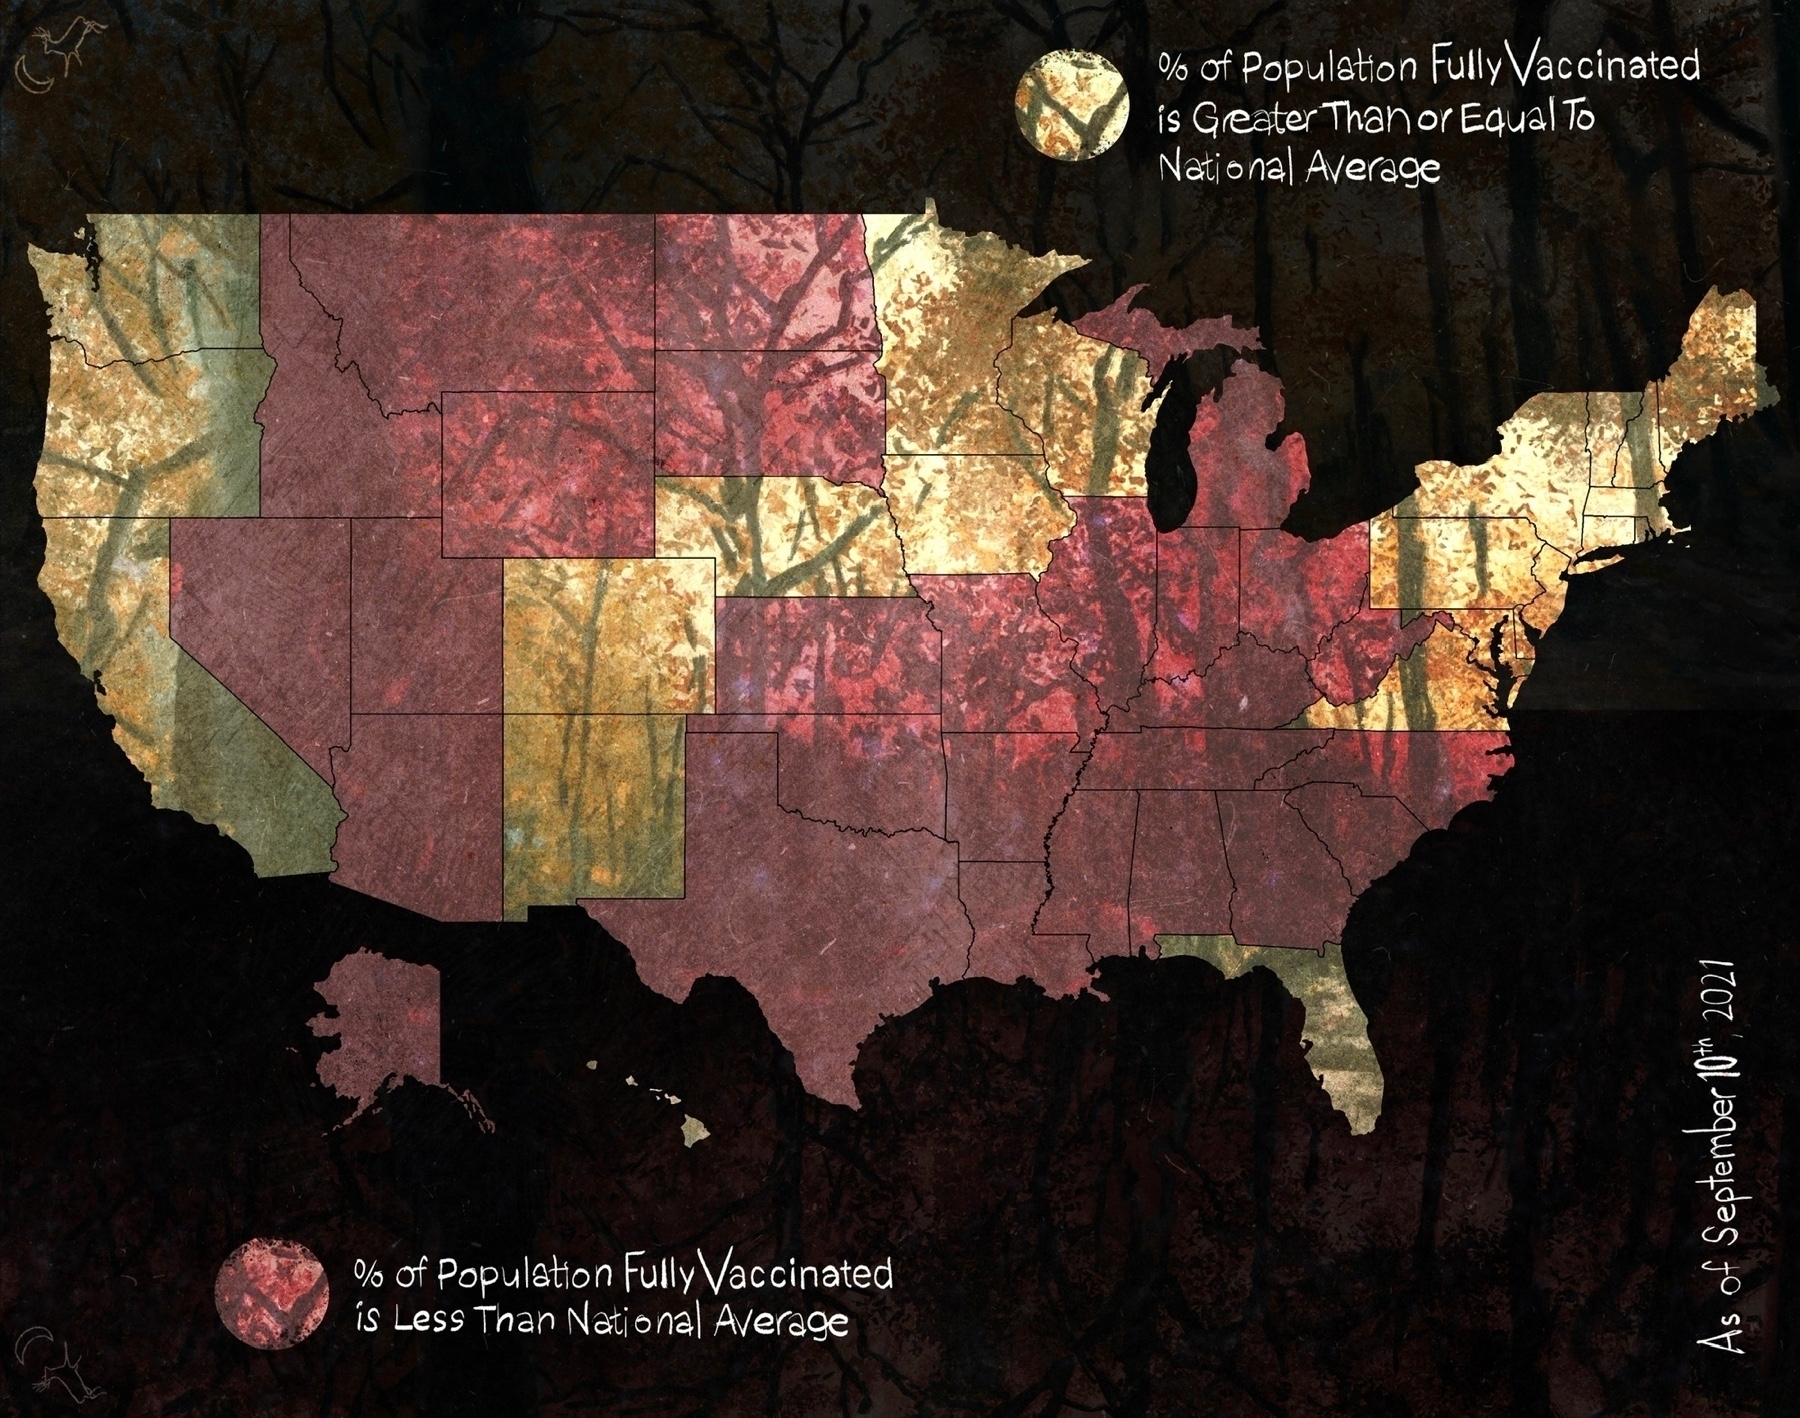
% vaccinated by state at scale
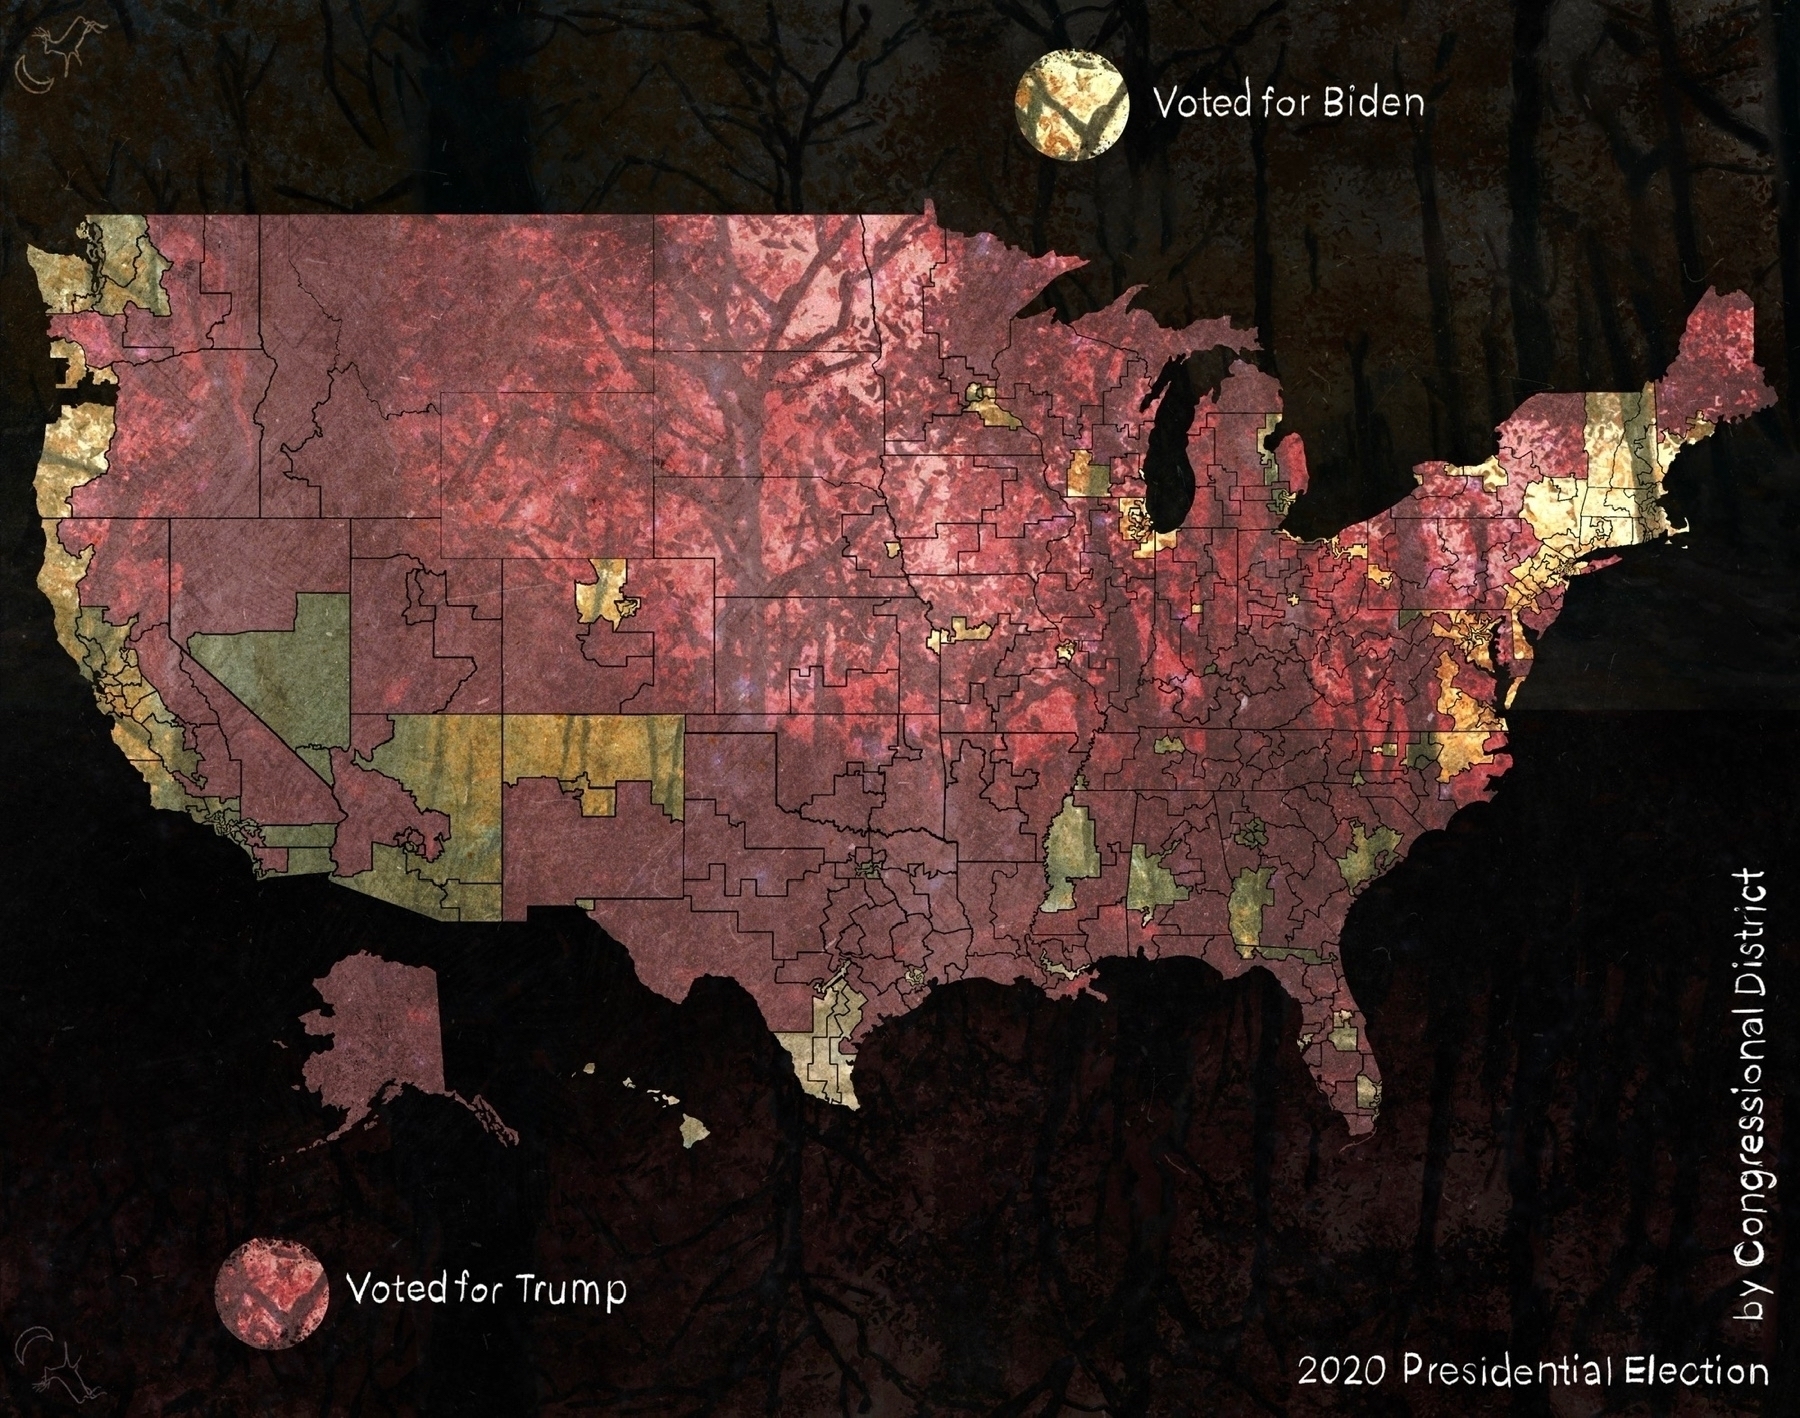
2020 Presidential Election by congressional district at scale
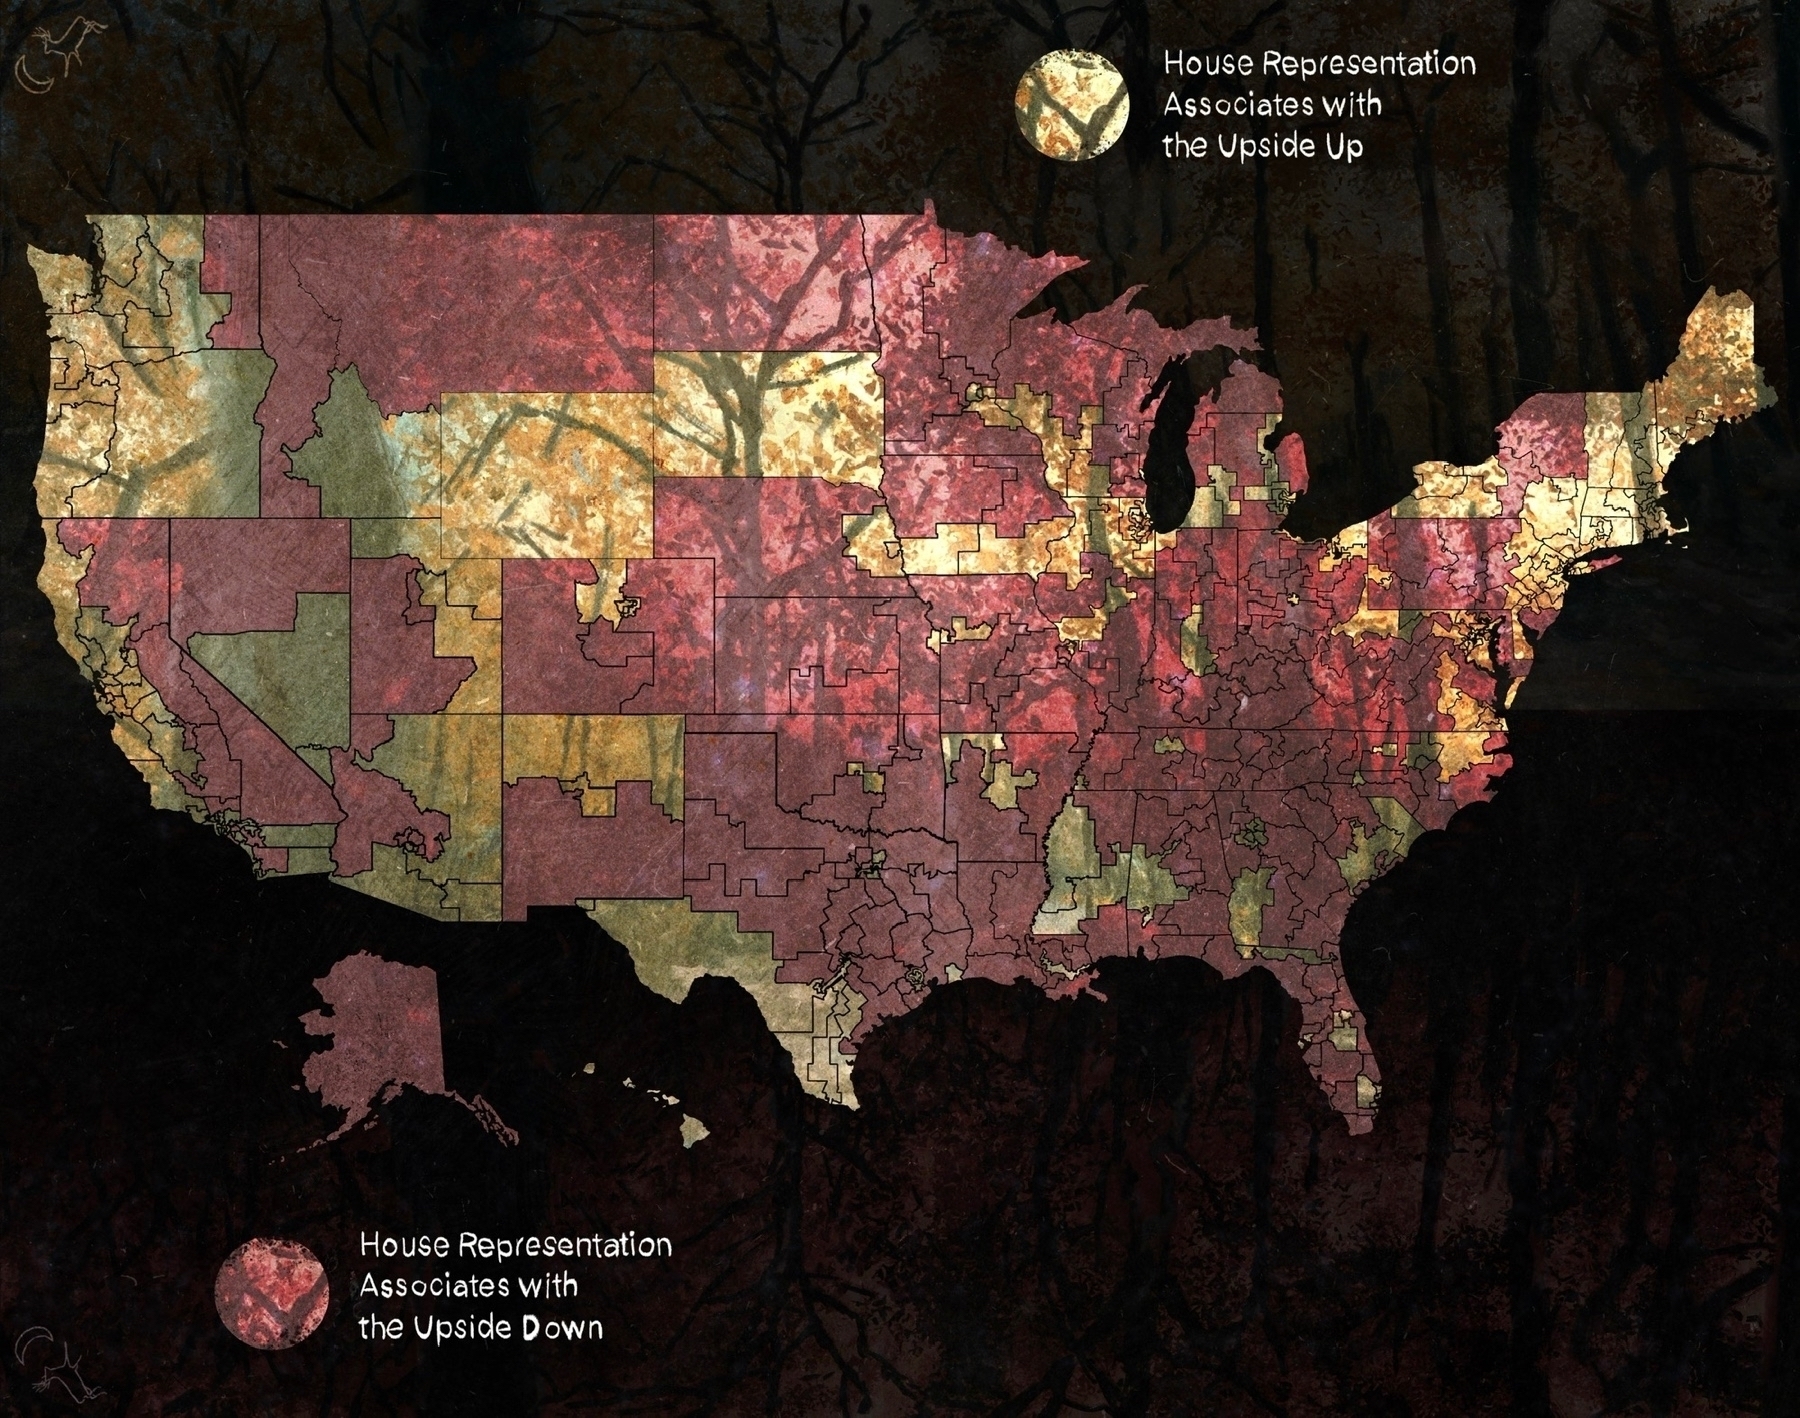
House representation reality associations by congressional district at scale (scoring explained in this post: moondeer.blog/2021/09/0...).
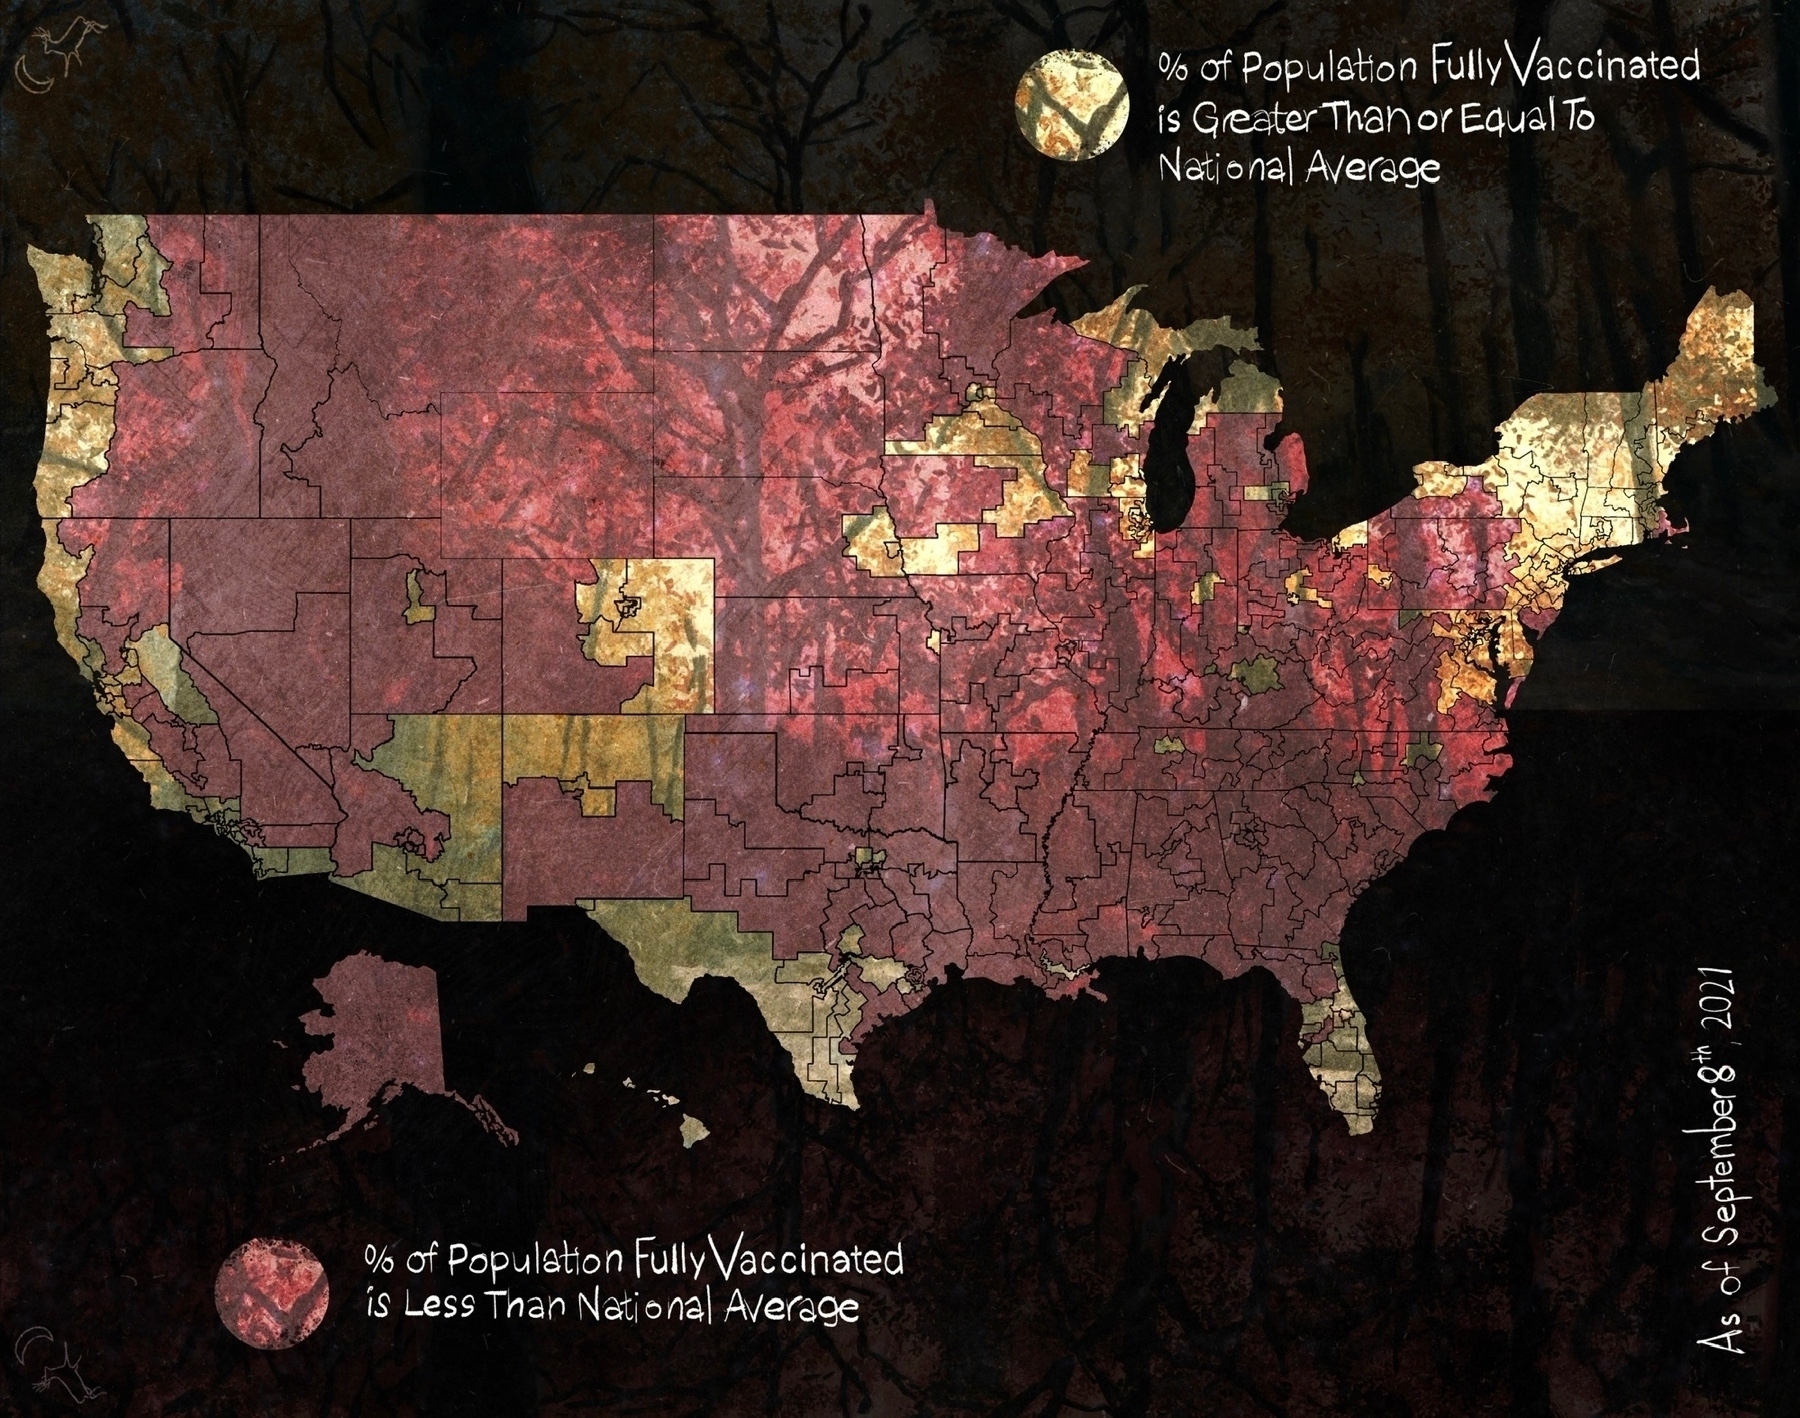
% of population fully vaccinated by congressional district at scale (and if you're paying attention to the fact that these maps are plotting against national averages, you'll notice quite a bit about where our population is concentrated).
% of population sick with COVID by congressional district at scale