

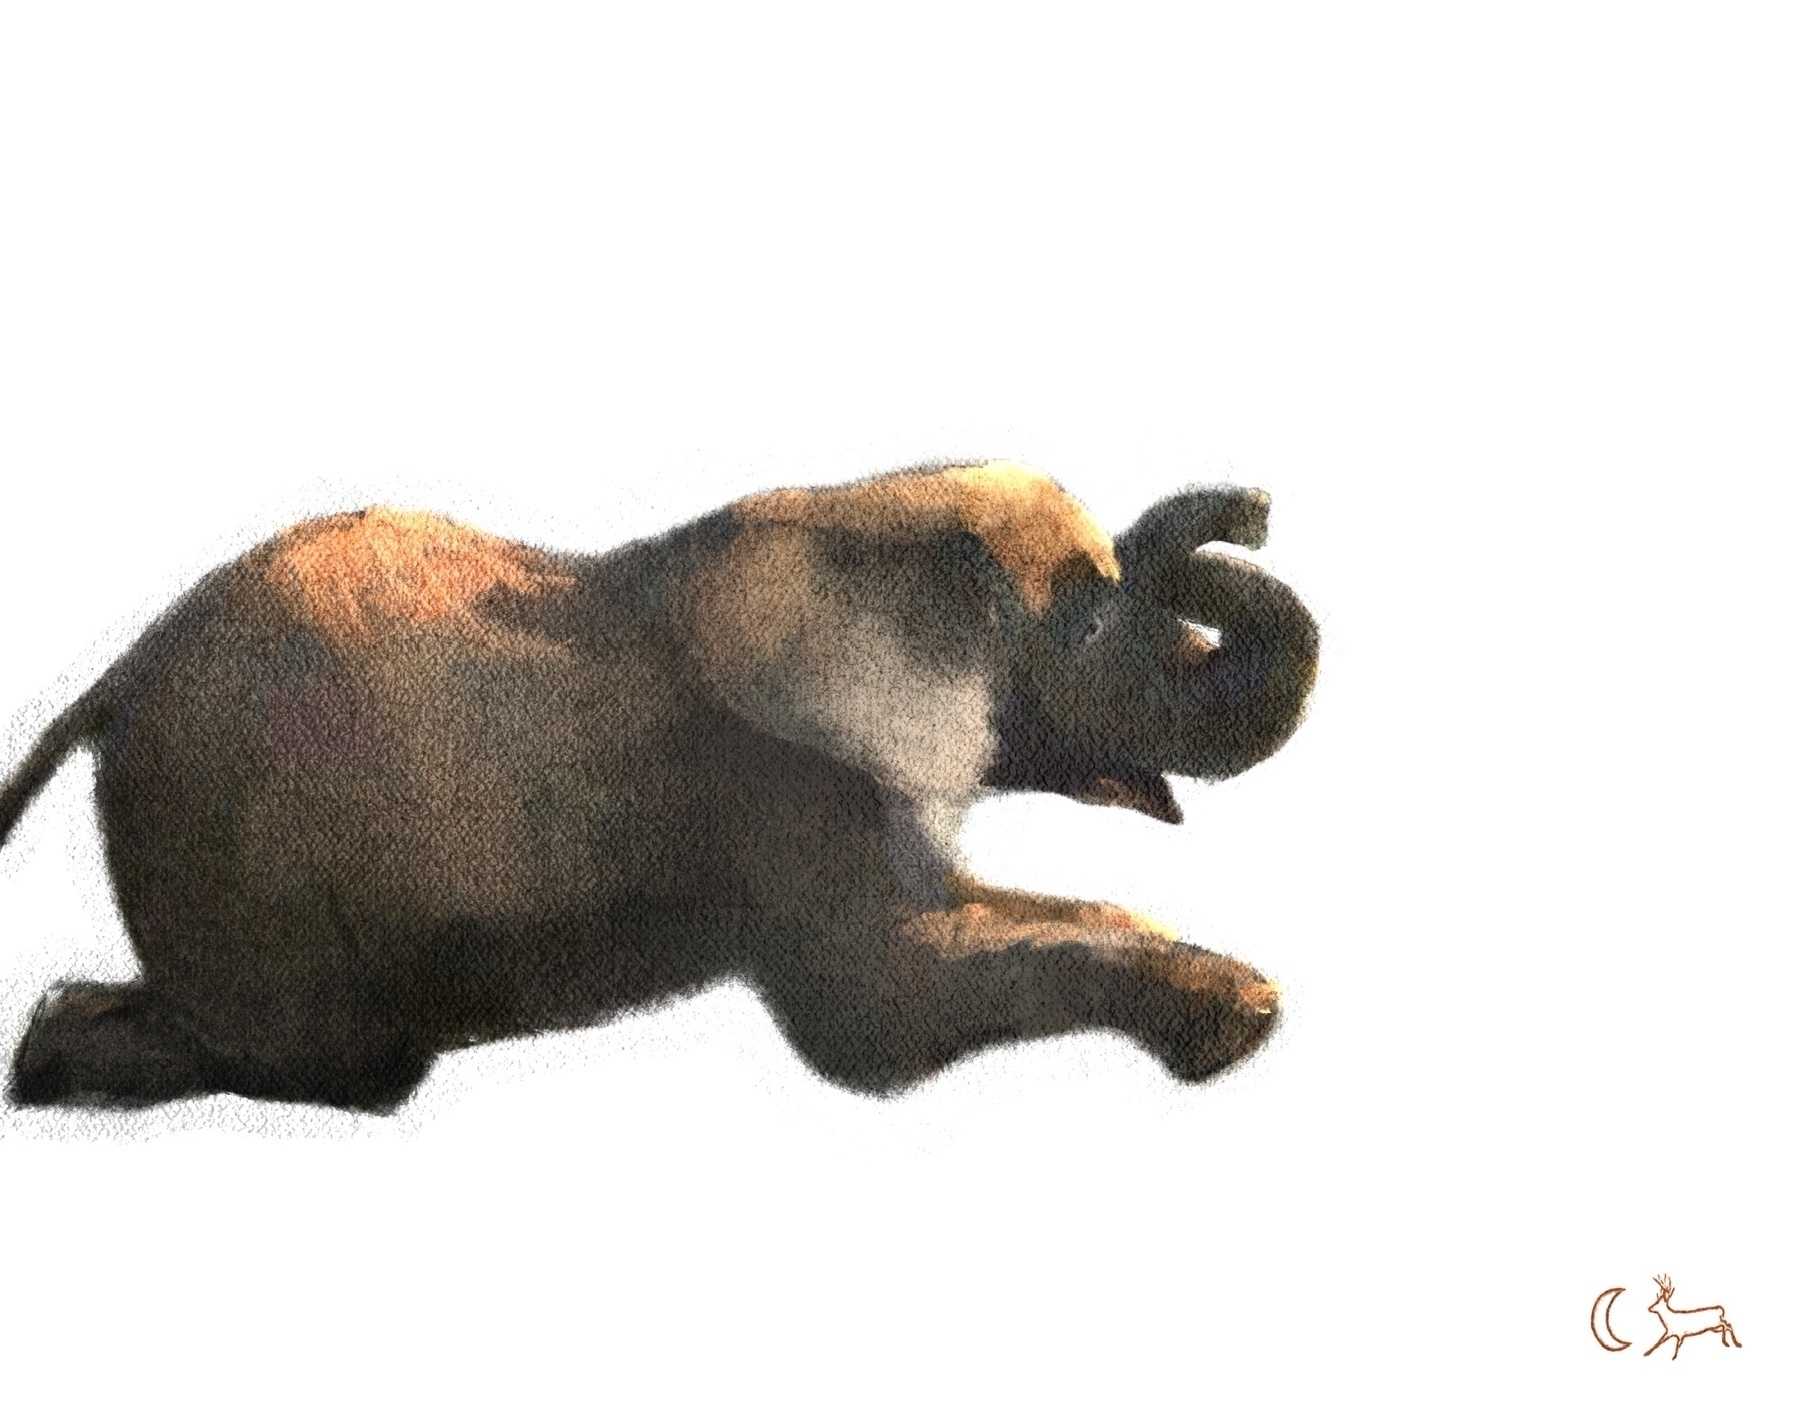
Another art concept just popped up that may jump the line. Thematic hint: the one you feed.
Some pre-show … post-dinner #iPhoneography
The expanded sand castle collection.
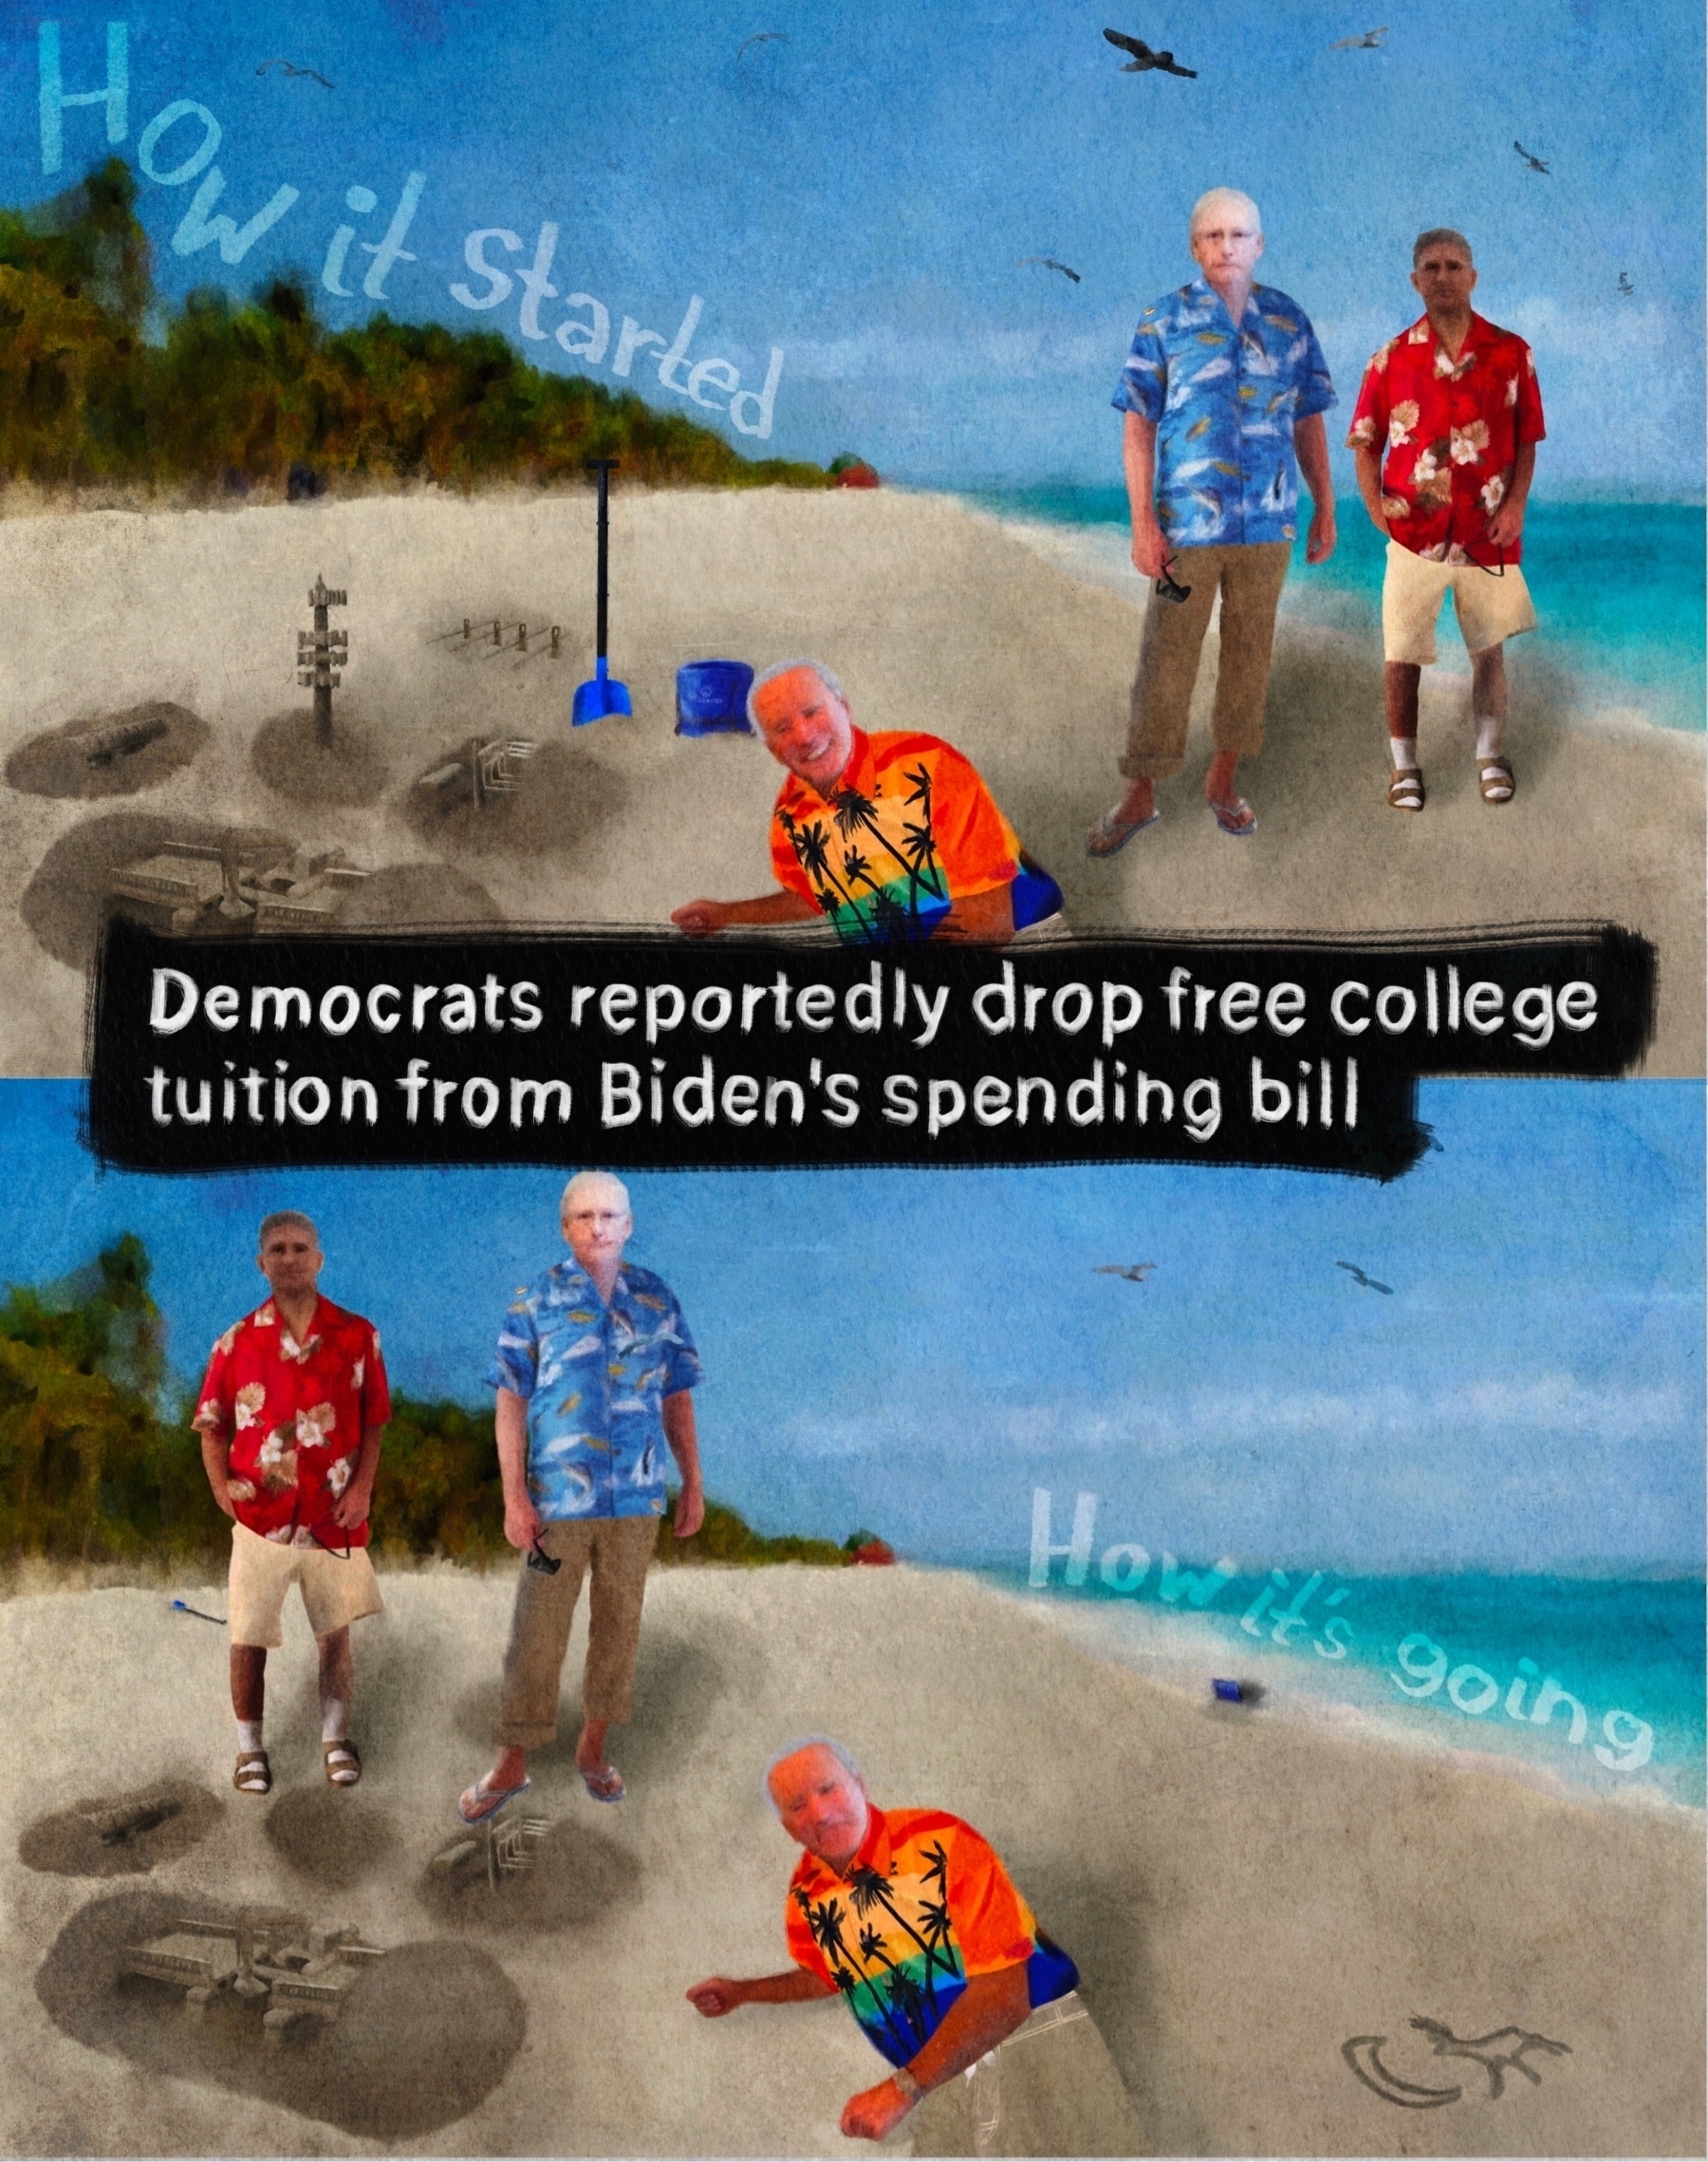
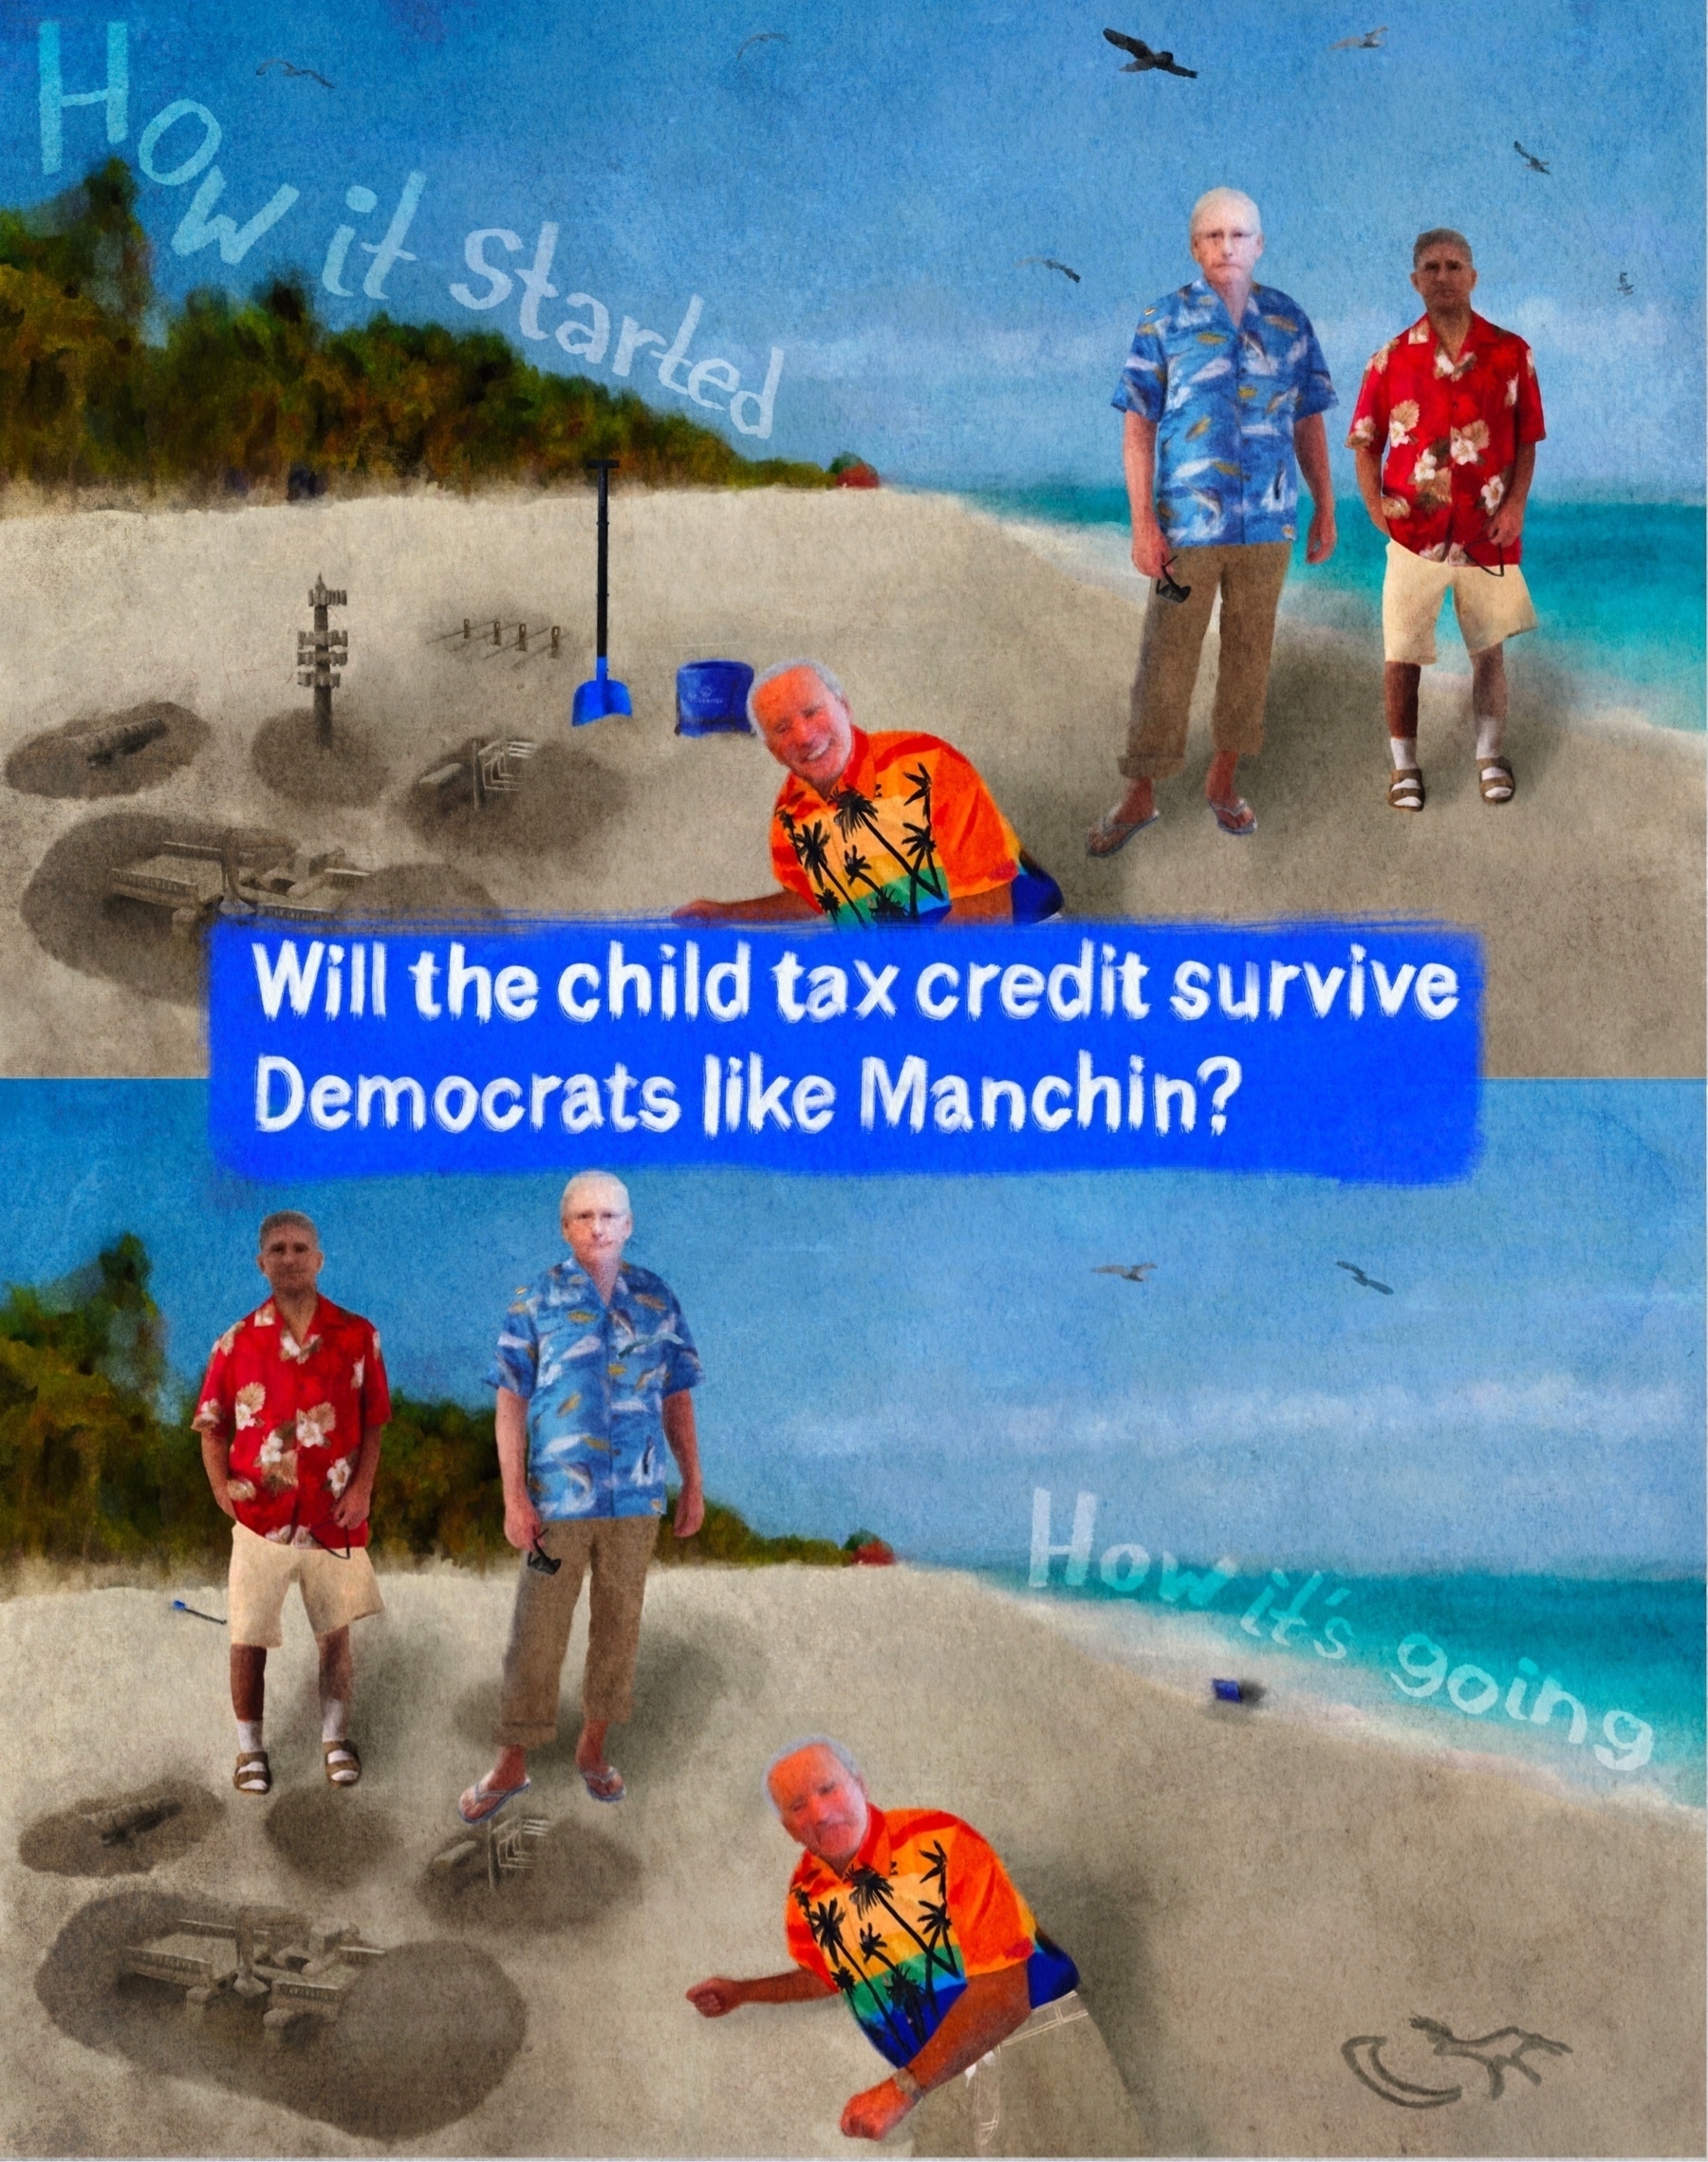
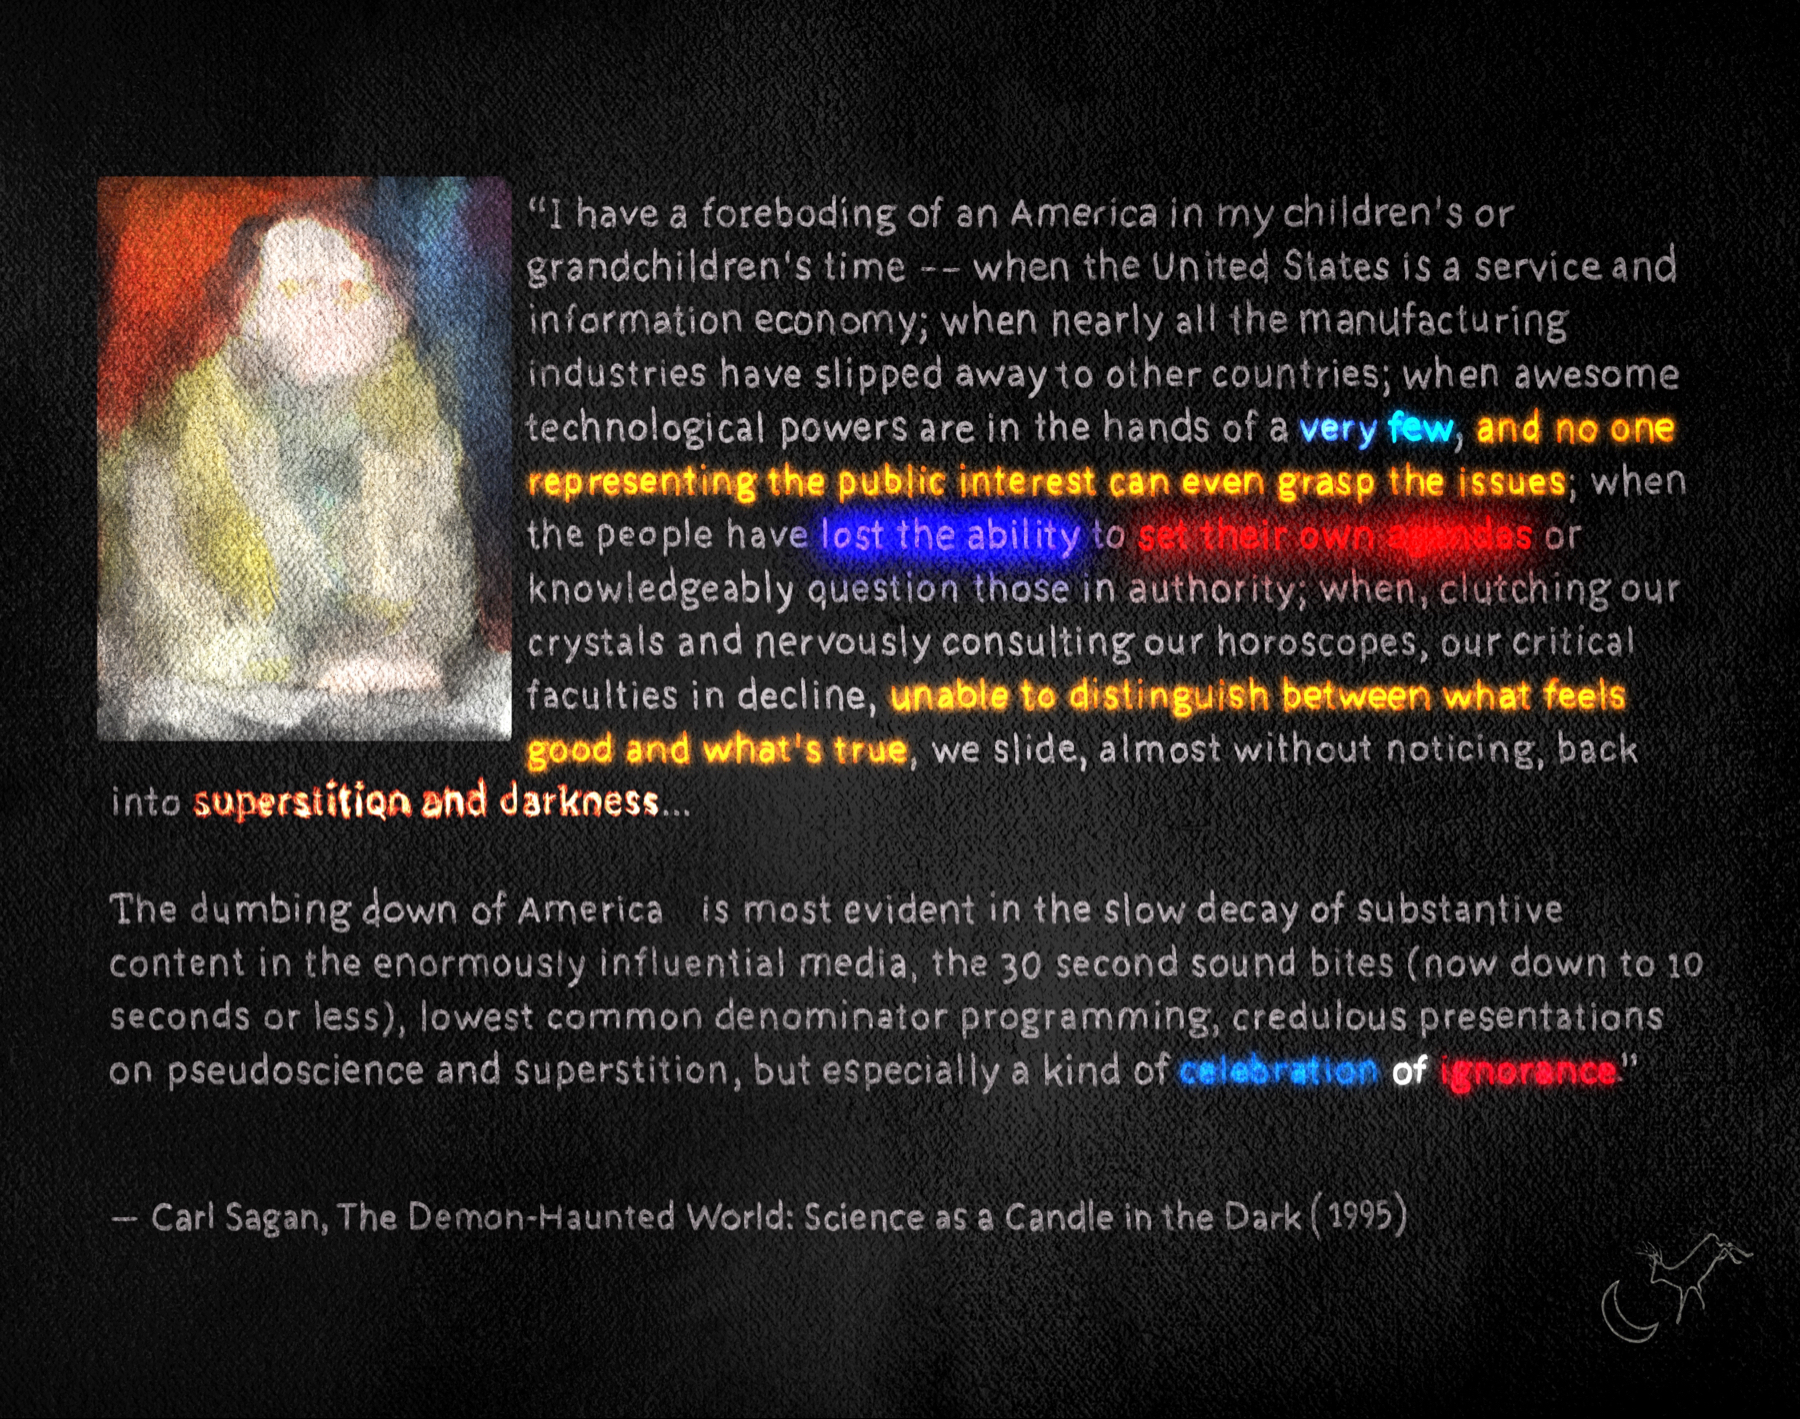
Decoding the color code in Carl's quote.
Hints as to the theme at the heart of the concept been creeping in today.
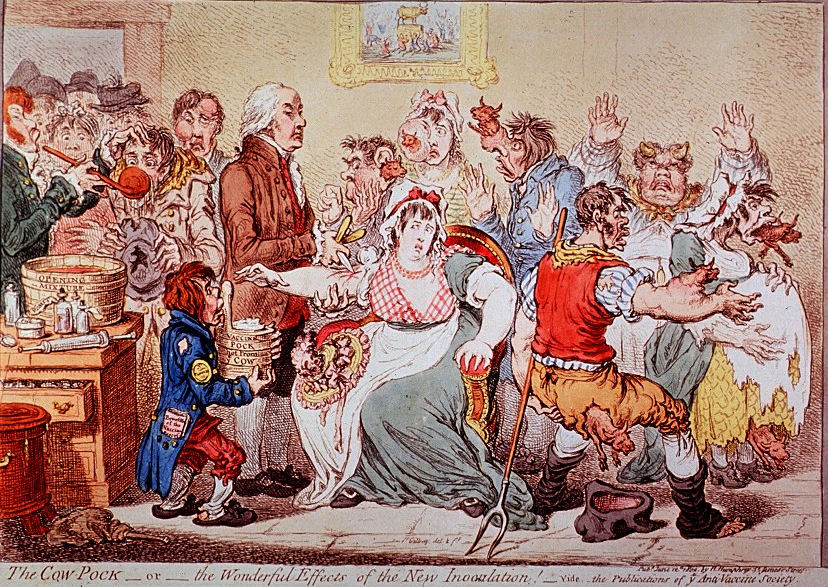
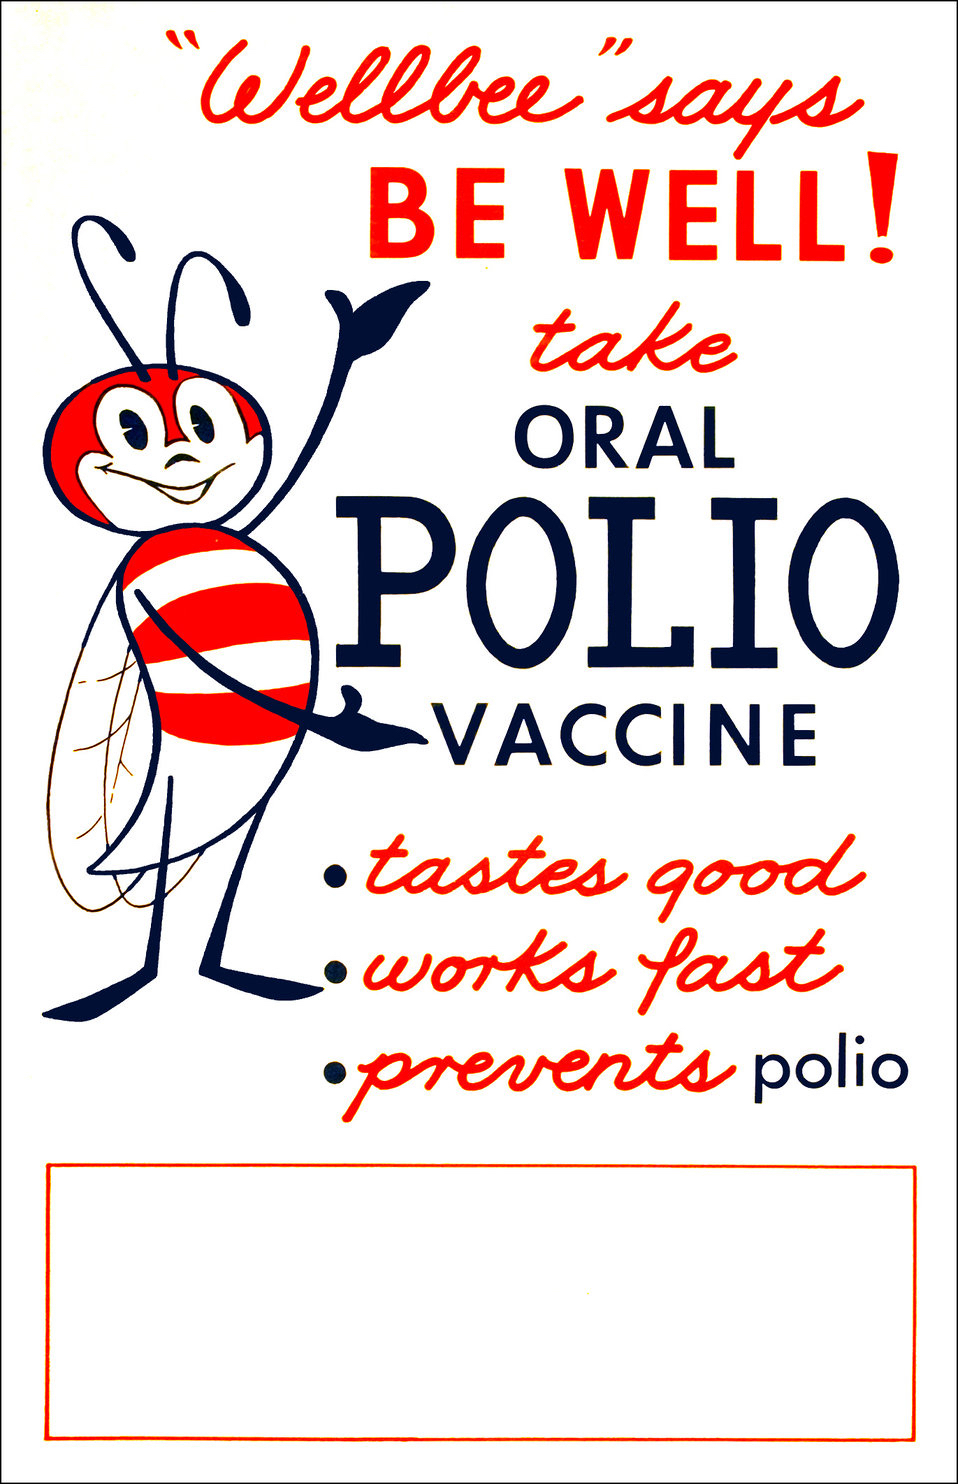
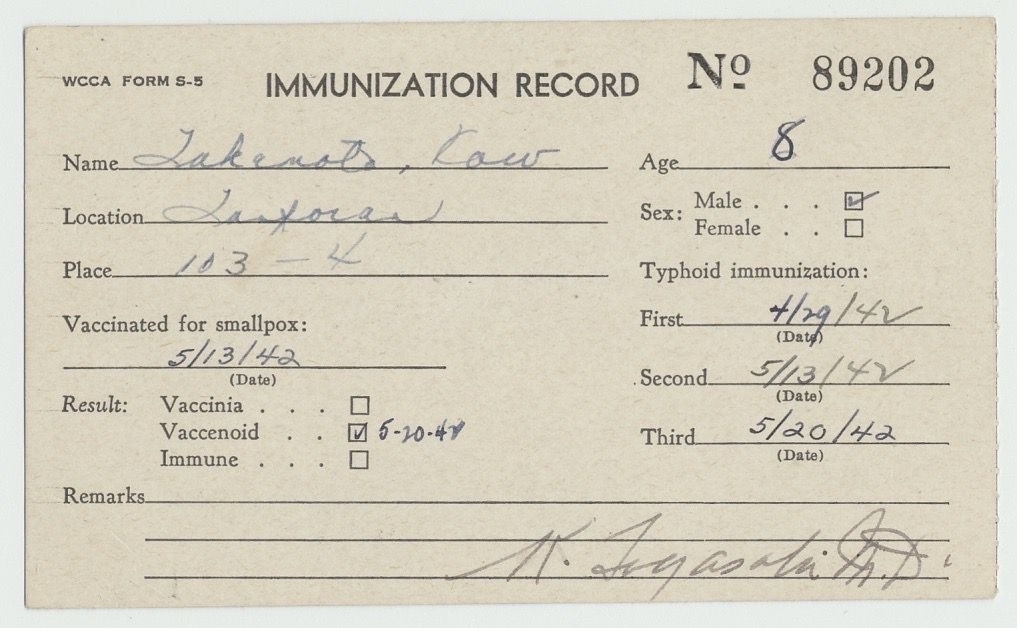
Calling this one final, attention span is movin' on.
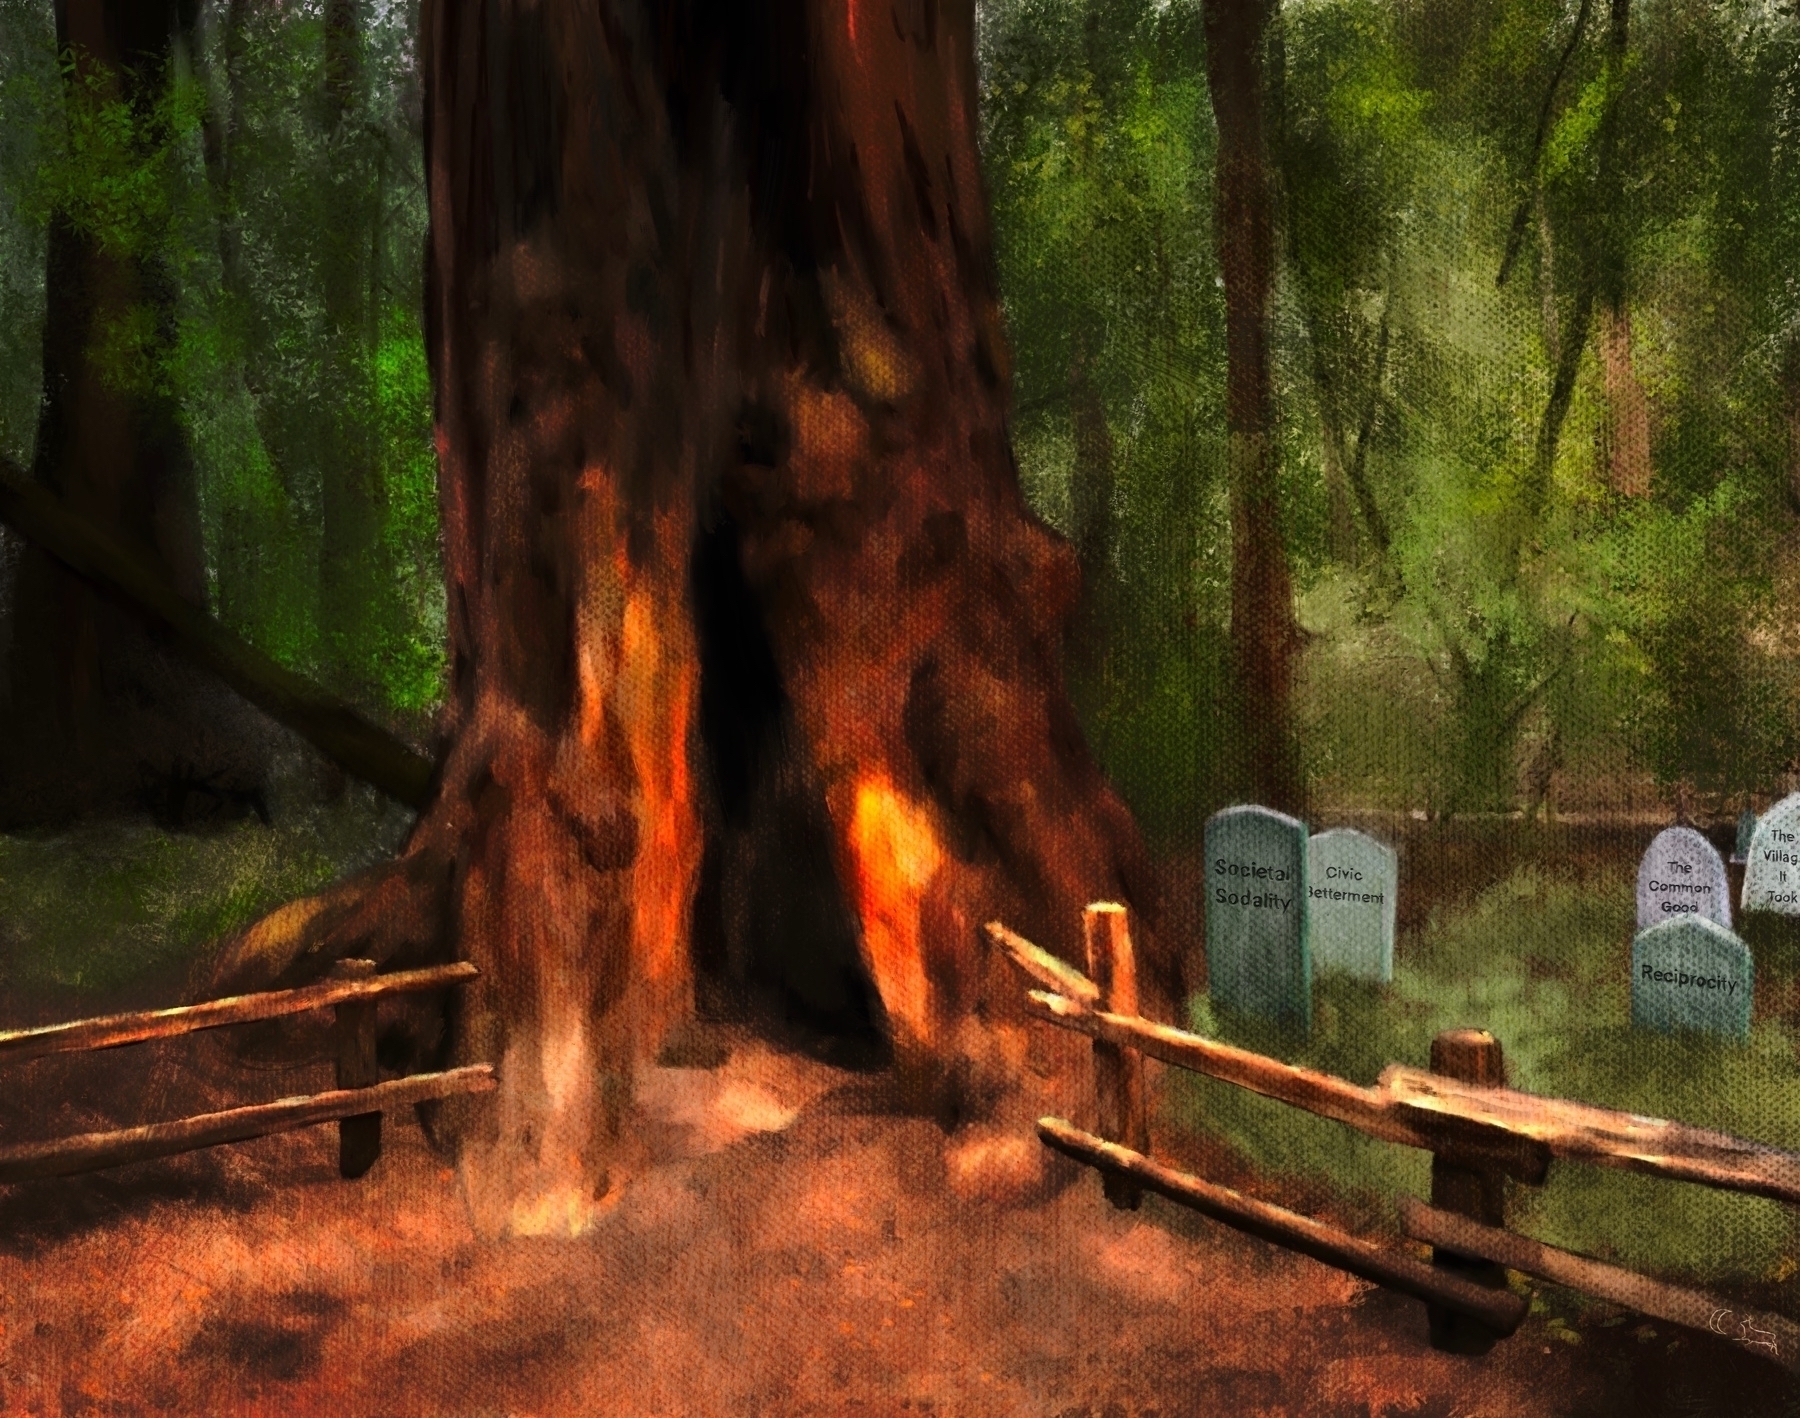
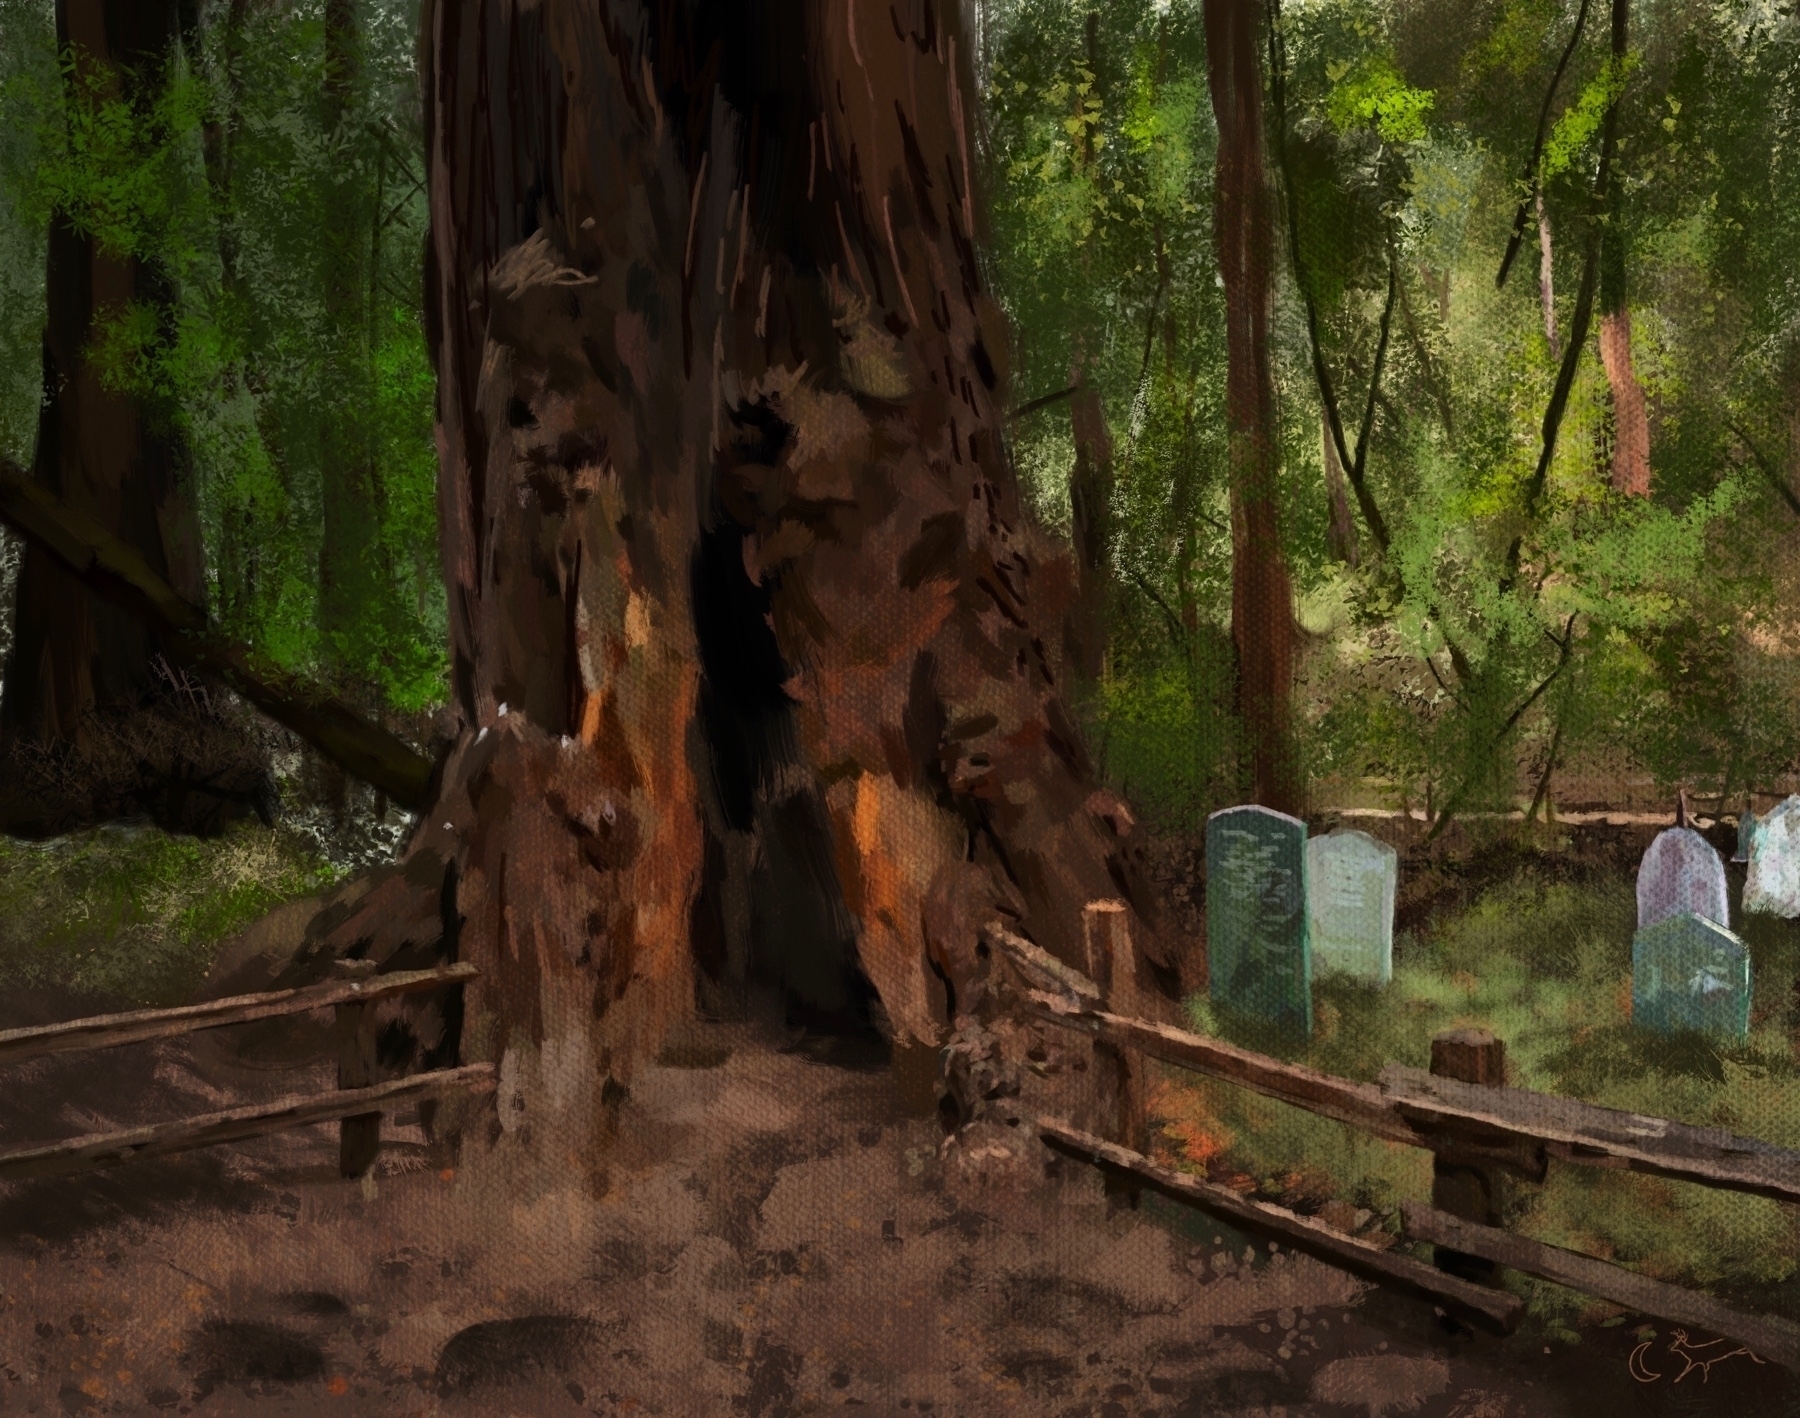
Rough draft with and without the canvas effect I can't seem to balance for this one. More effect makes the tree pop, and kills gravestone legibility.
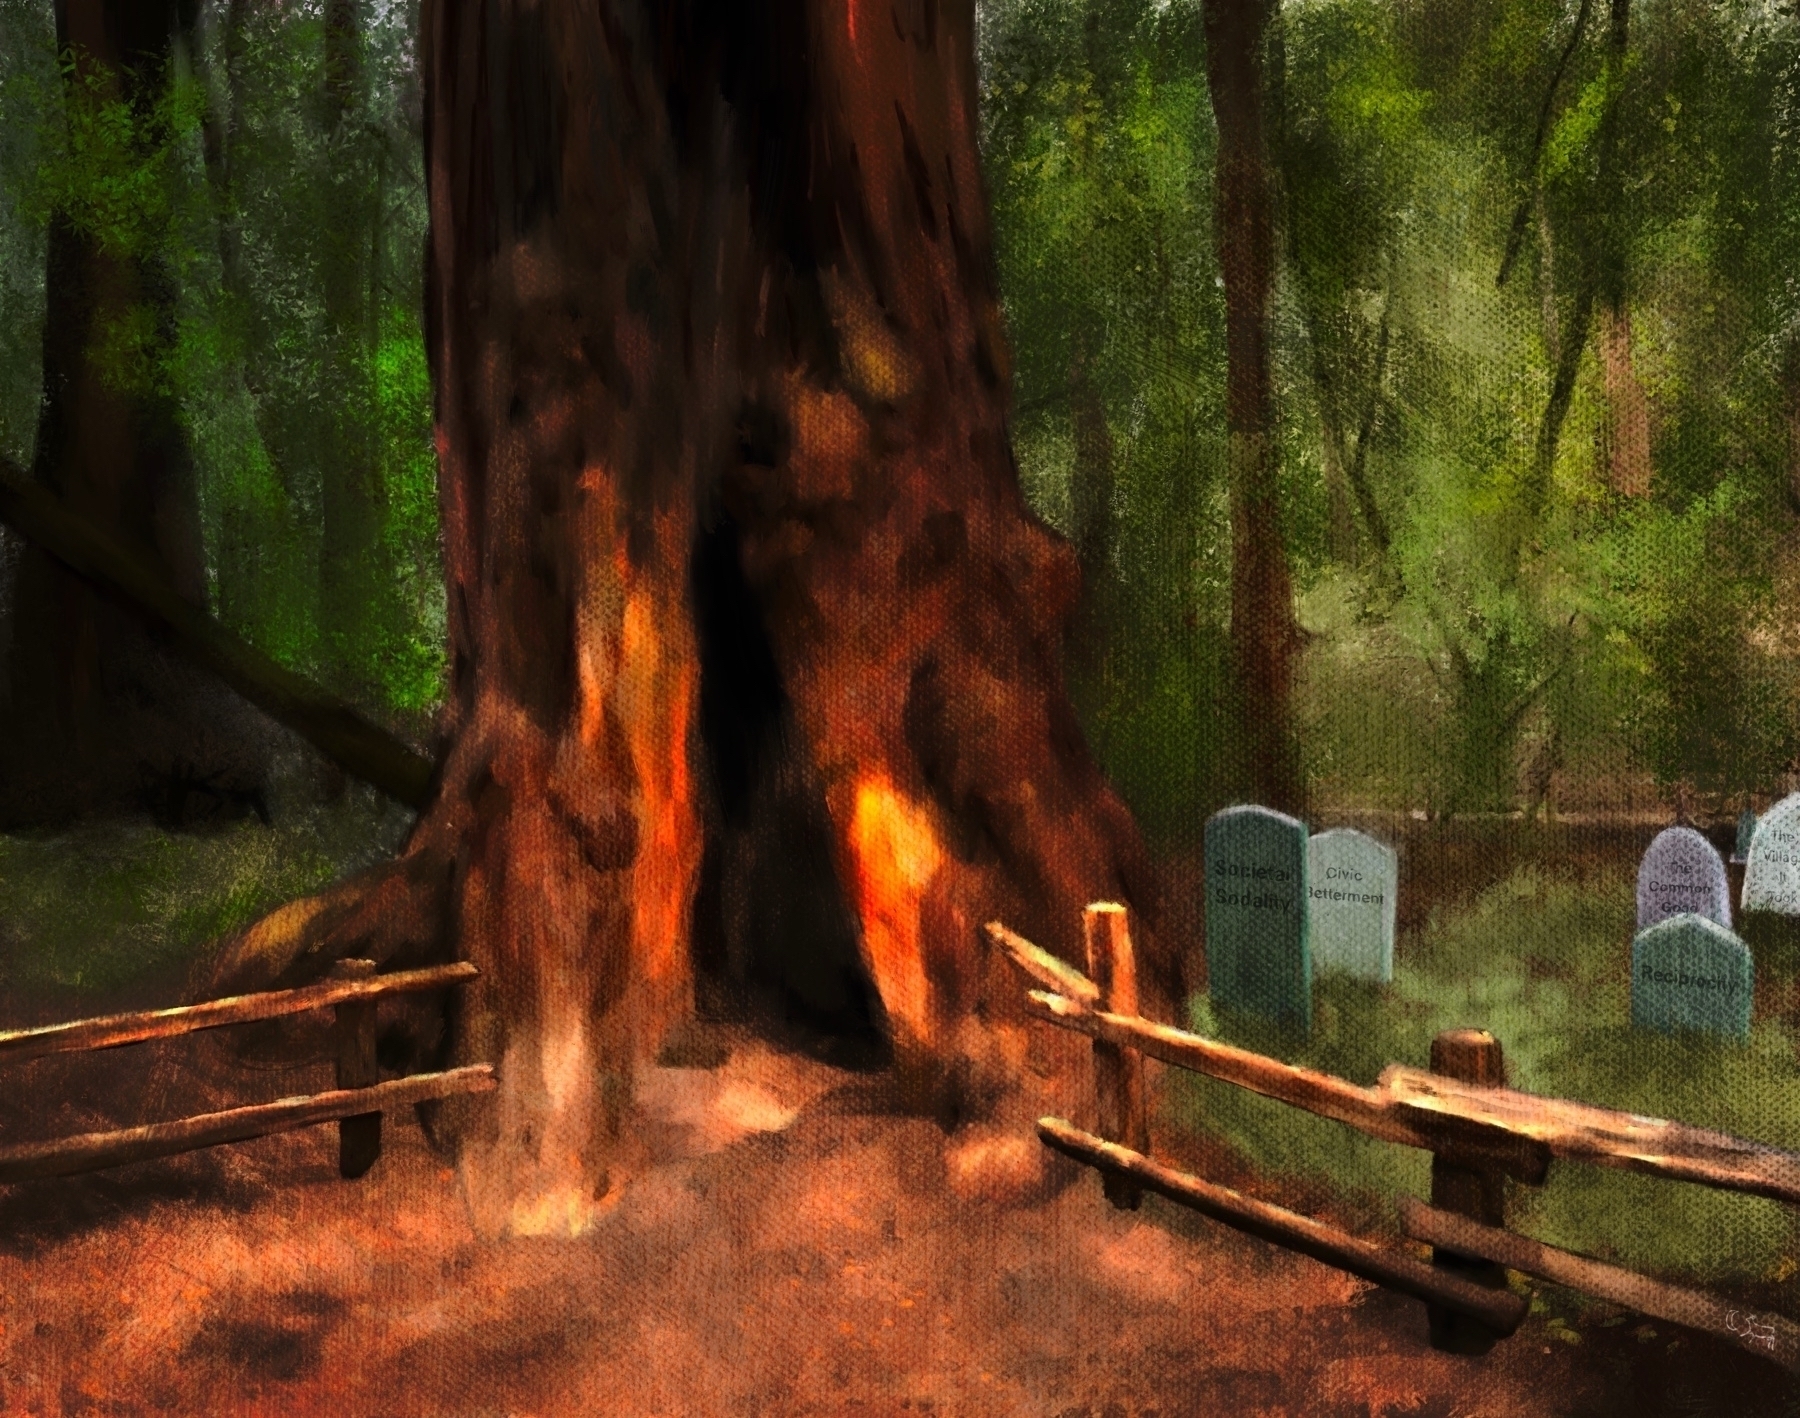
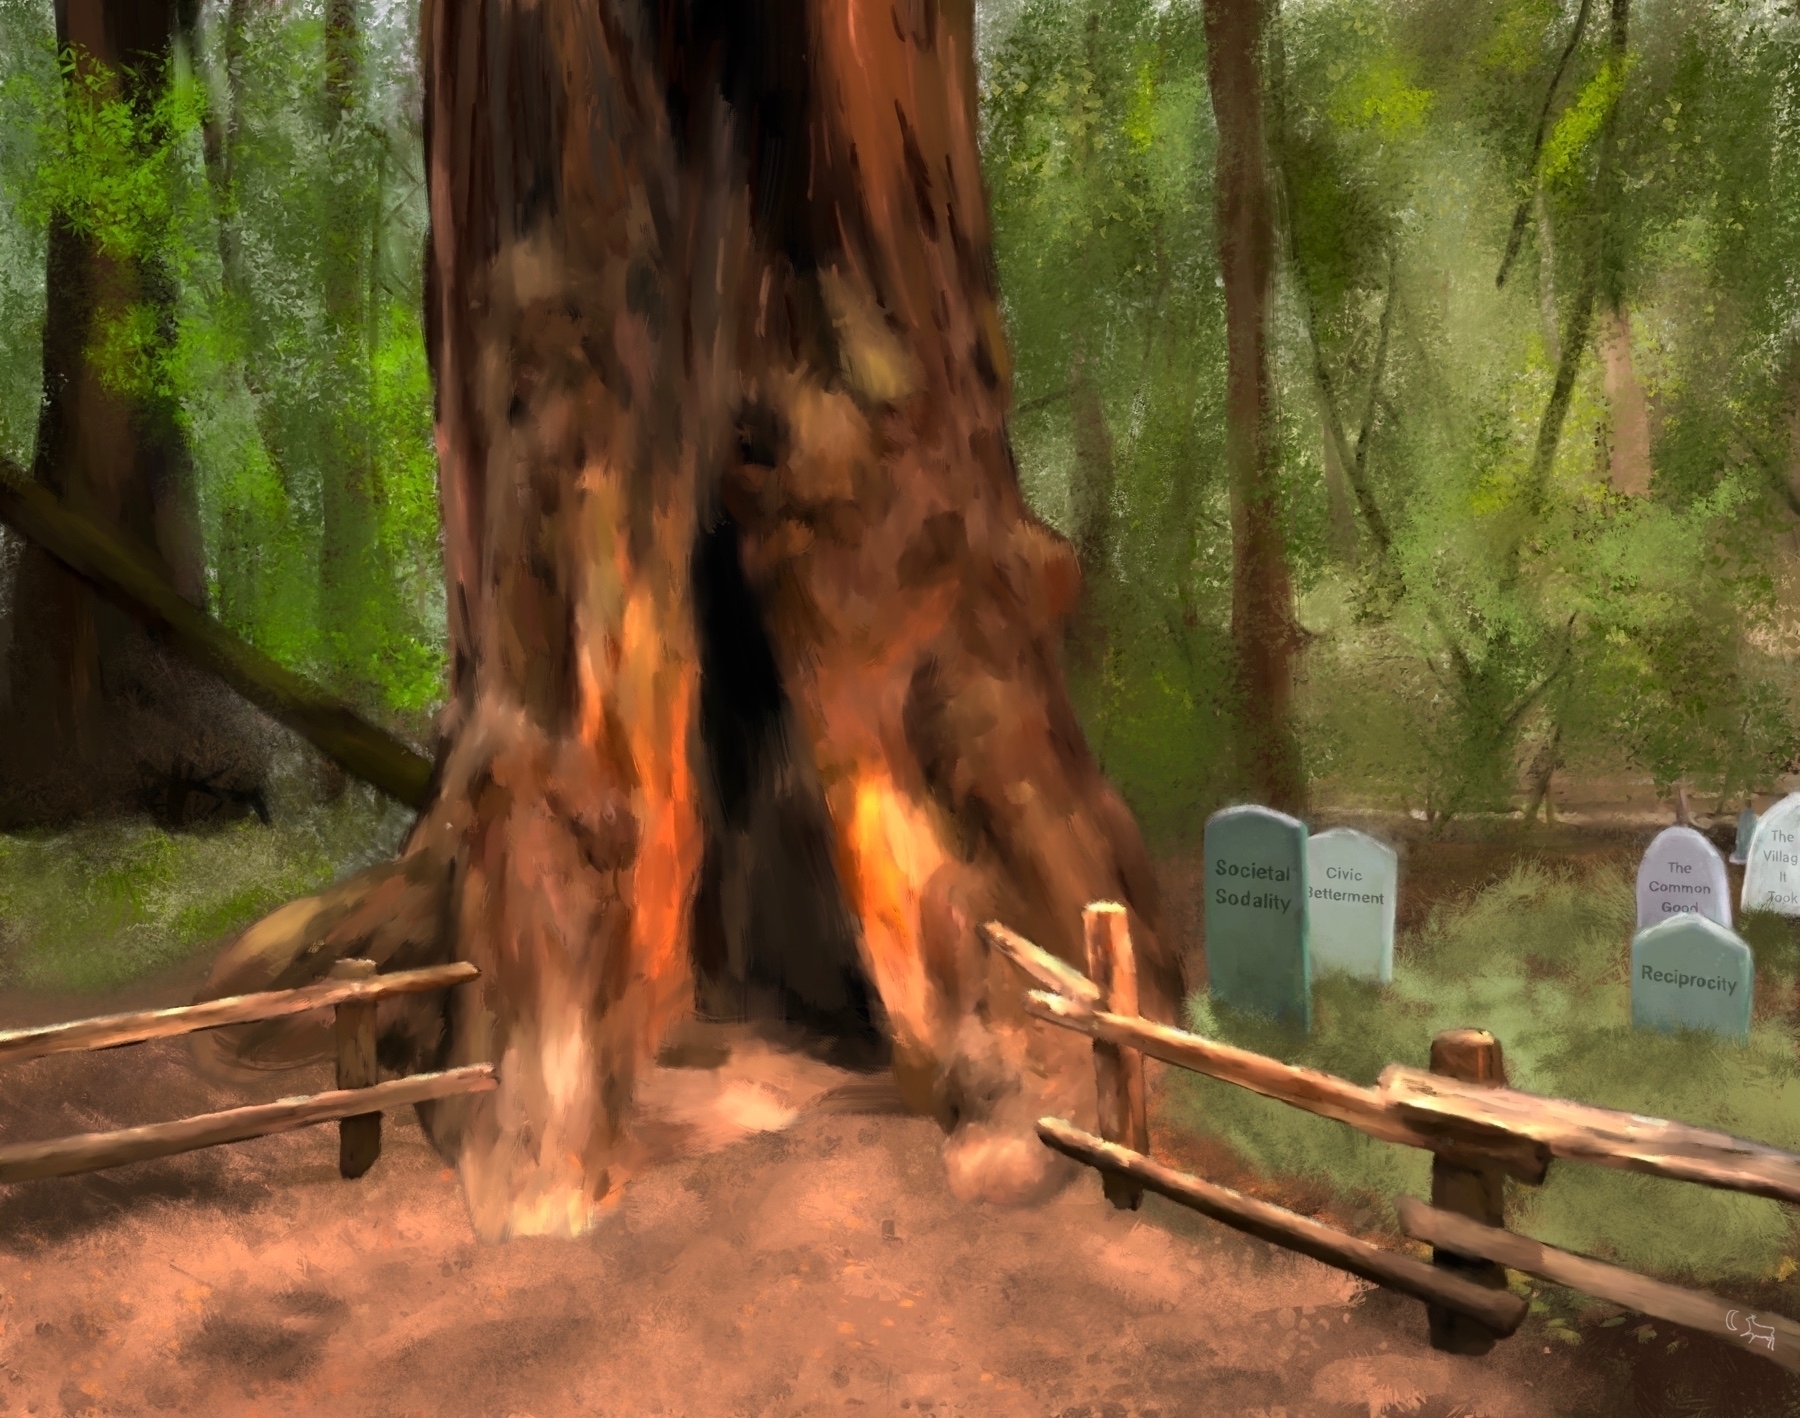
Been working on something to accompany this one when I polish it up: moondeer.blog/2021/10/1... Probably got half way.
I see that things continue to move along as expected.
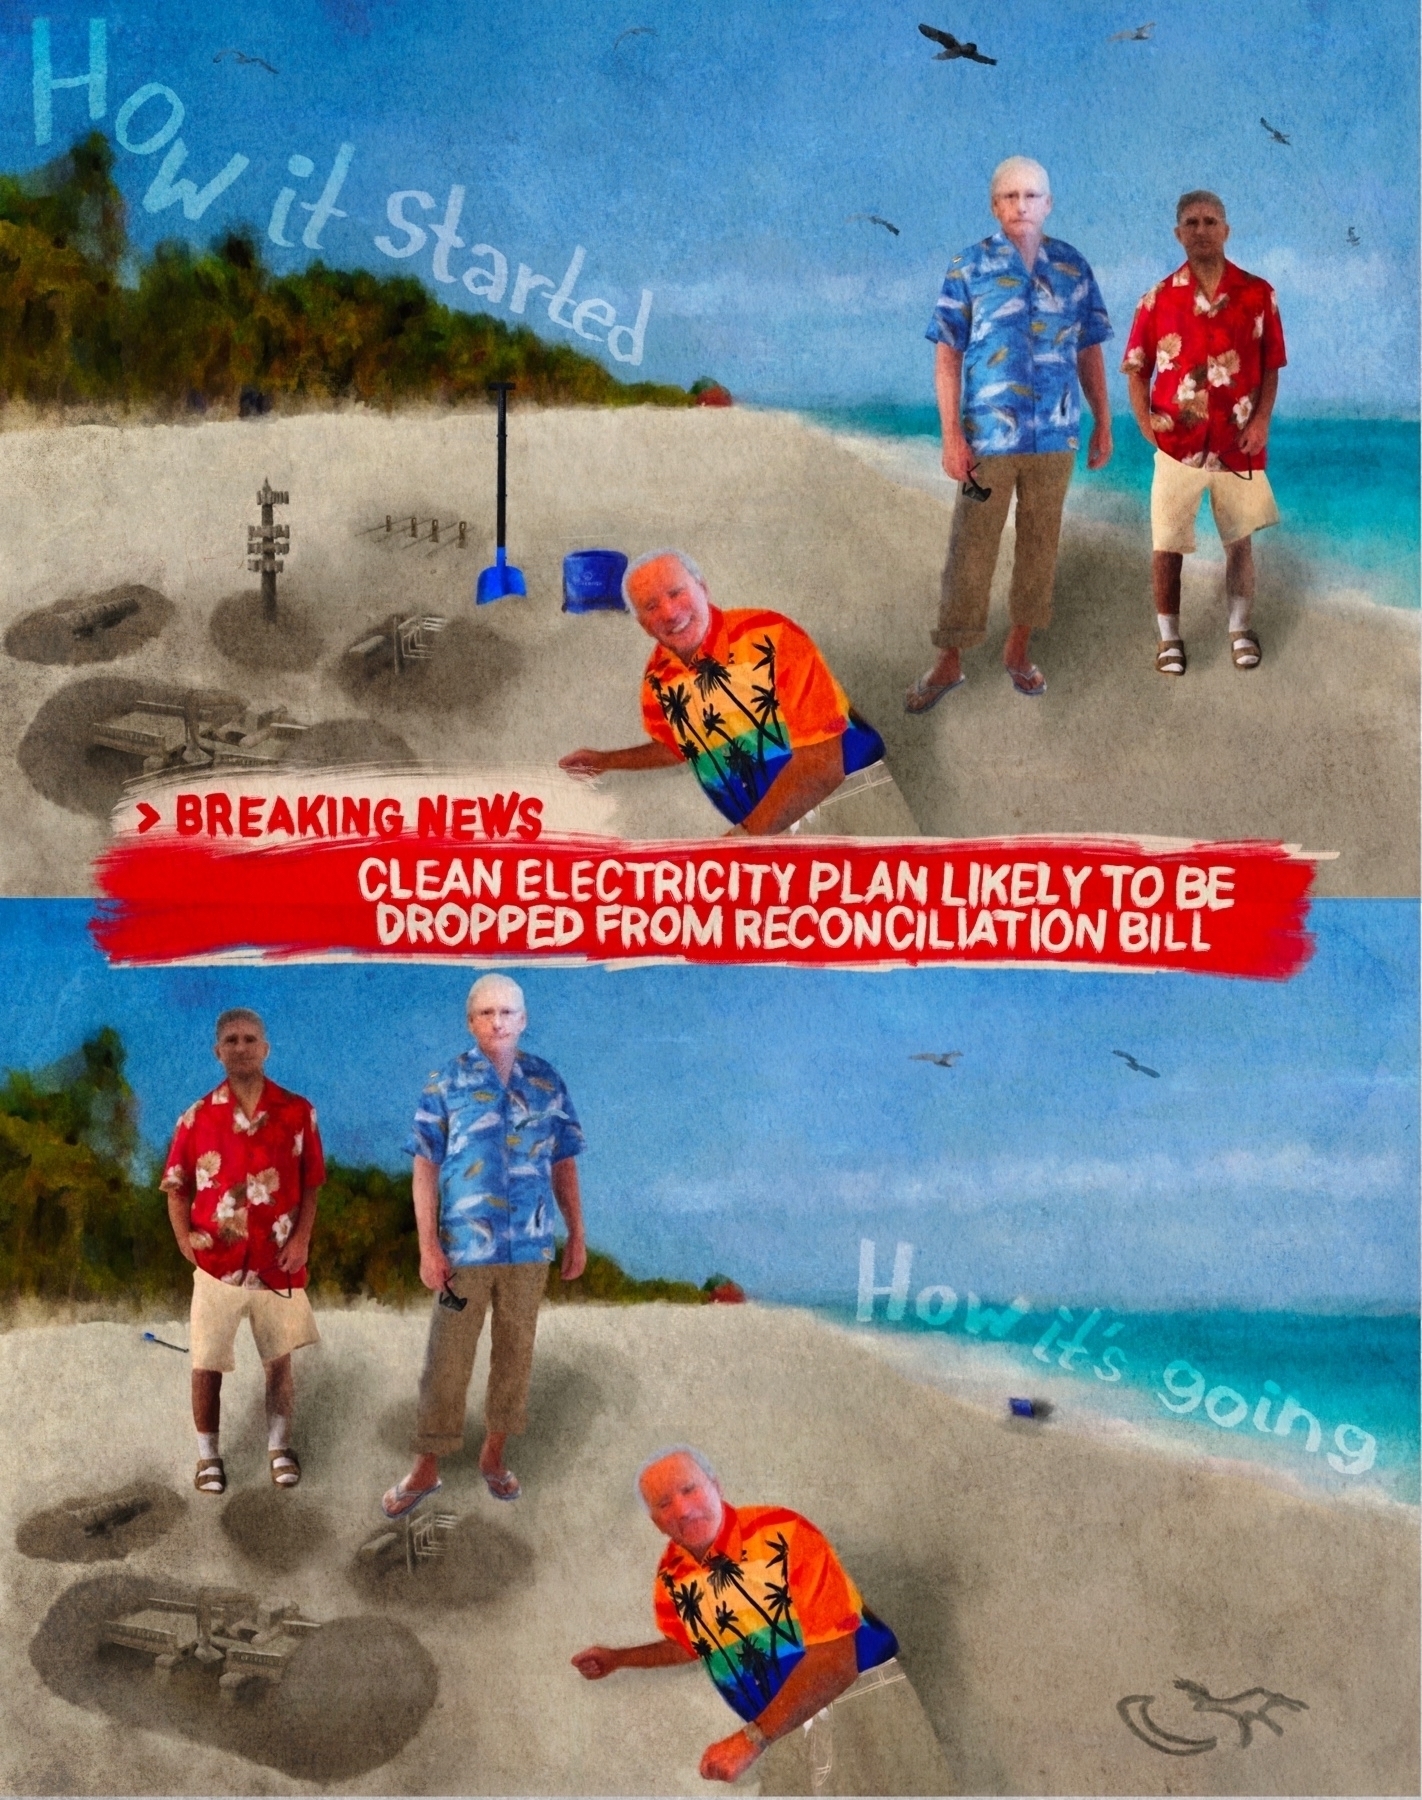
Not sure if you've seen this one, @DomainJulian. It marks the first time I had an essay in mind (not backed by a pre-existing Twitter thread) and purposefully generated some art to accompany before digging into the writing of the thing.
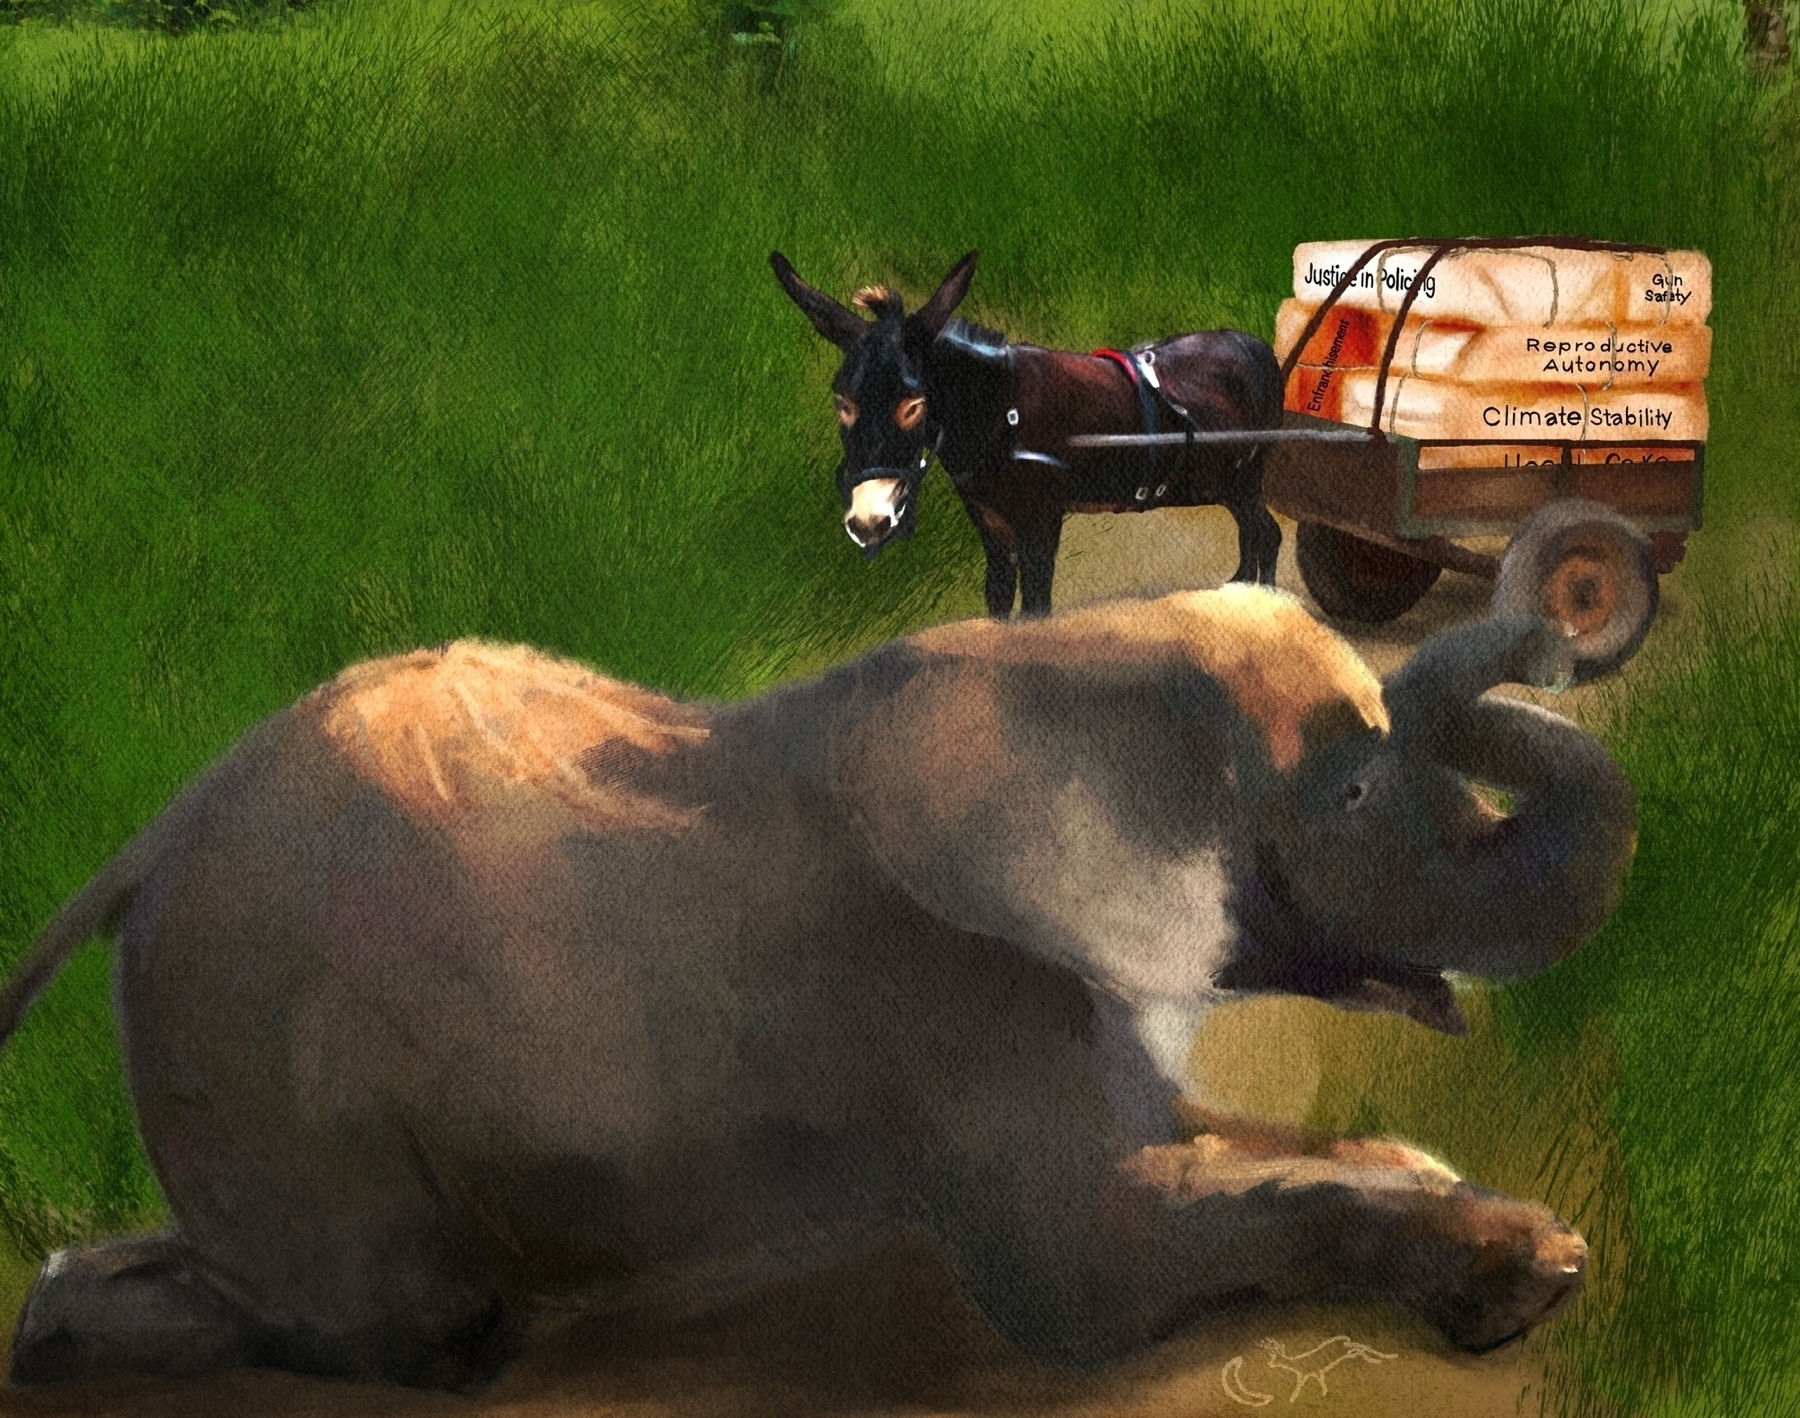
Calling this done, suppose it's time to start writing.
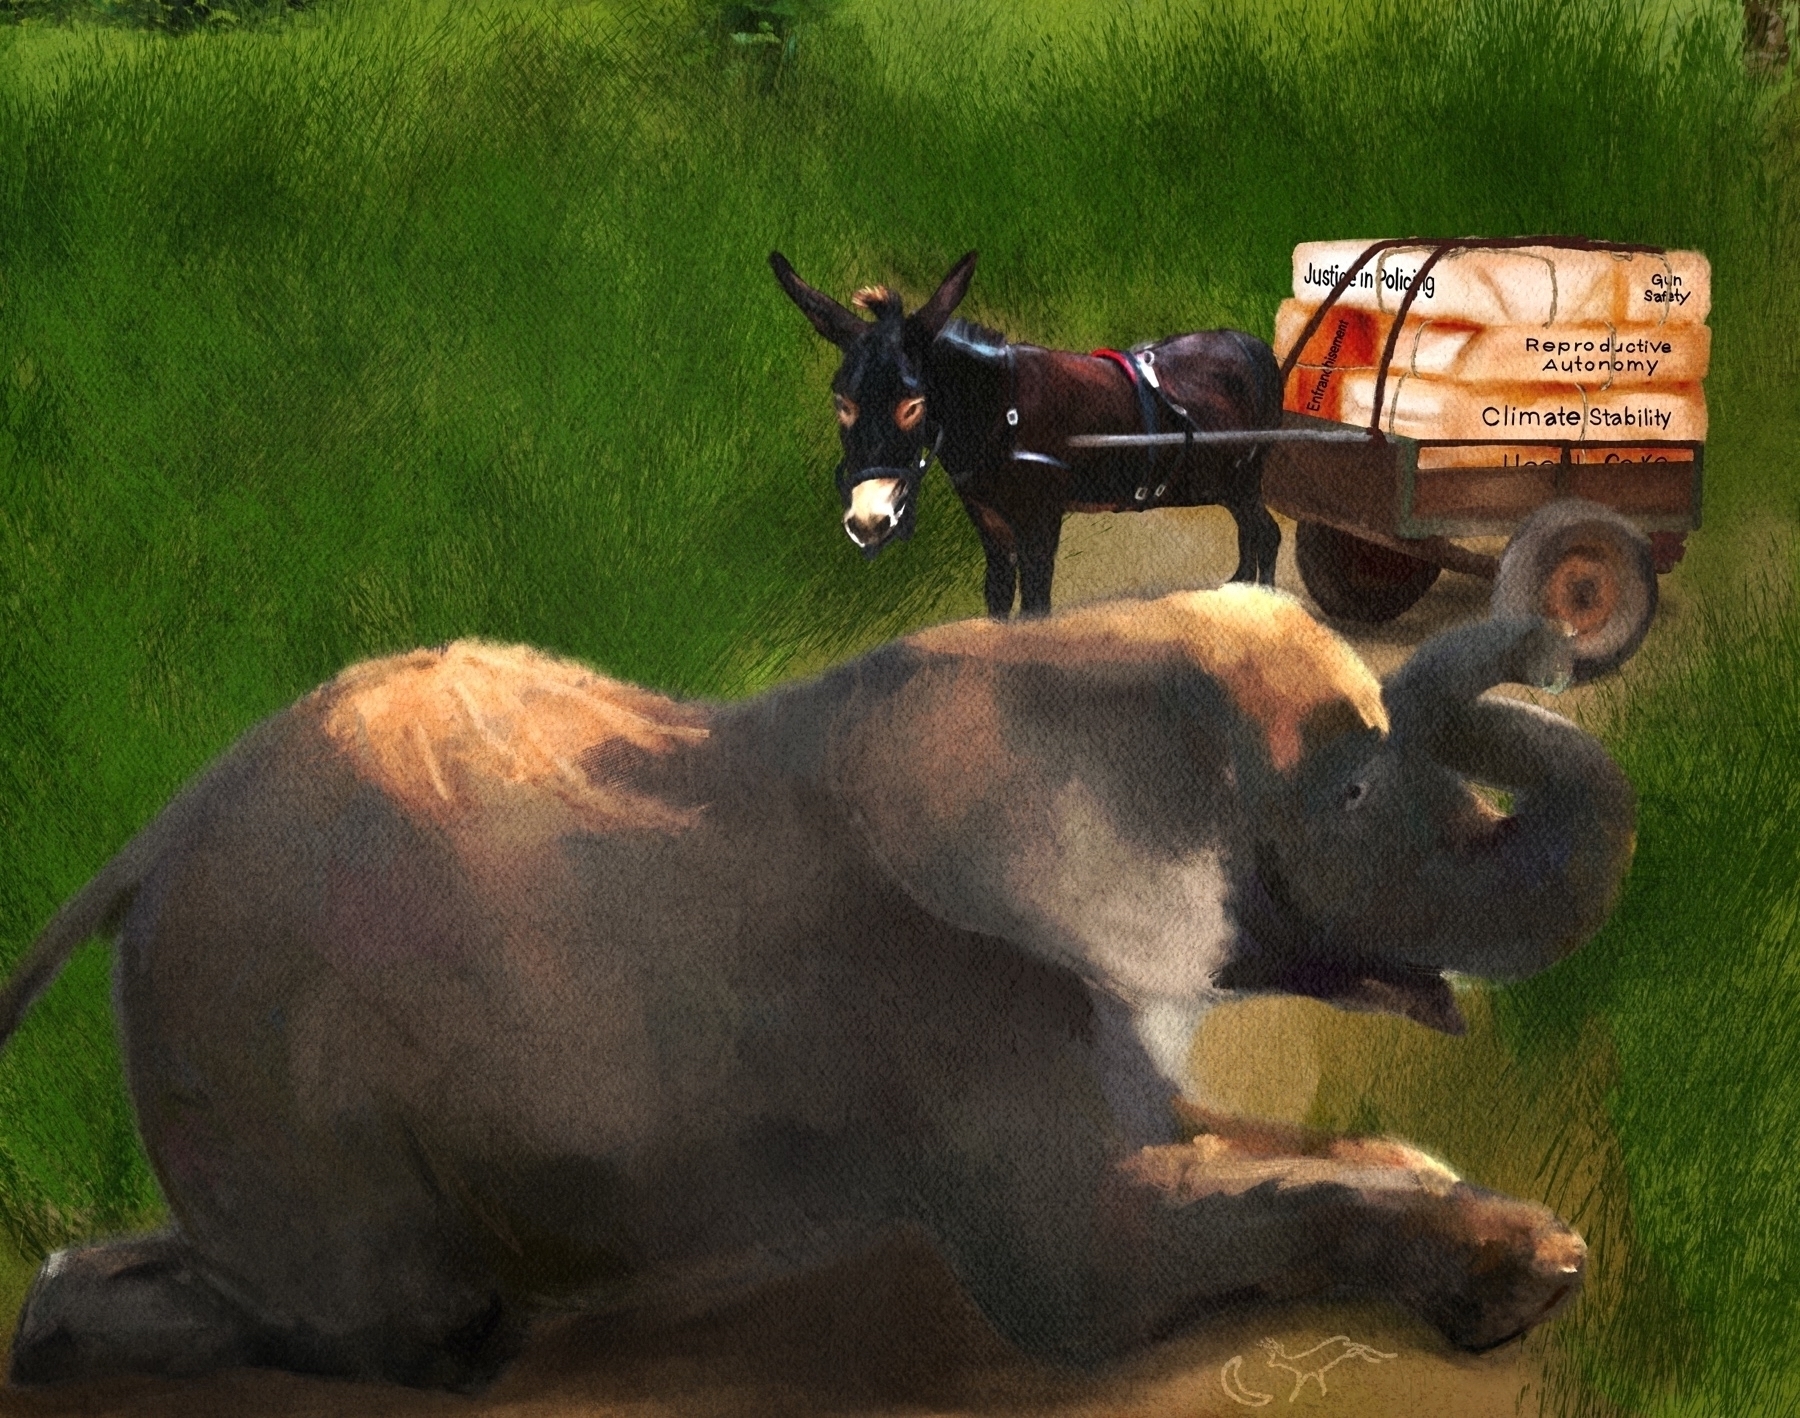
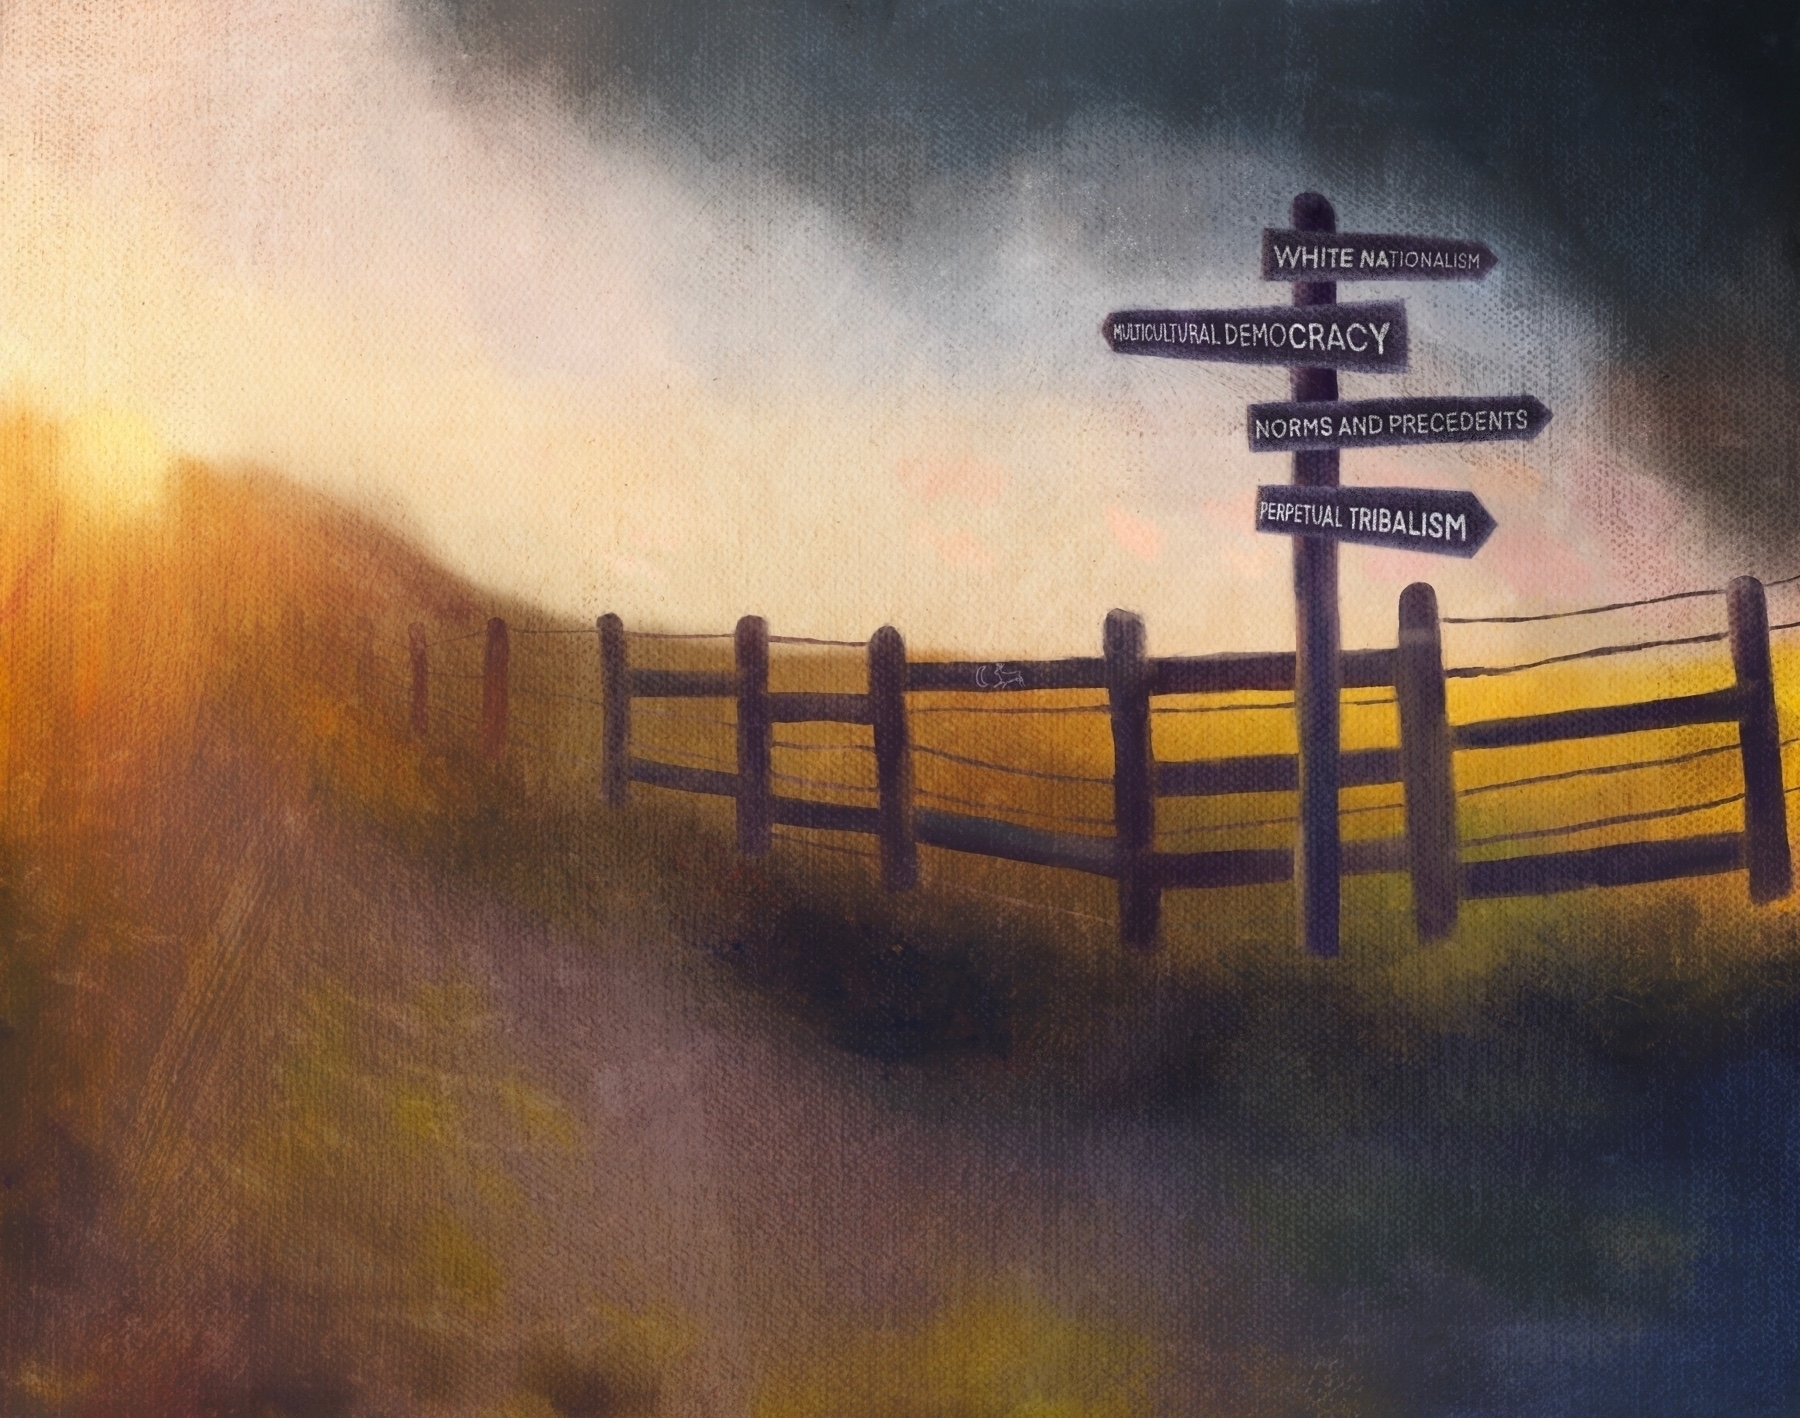
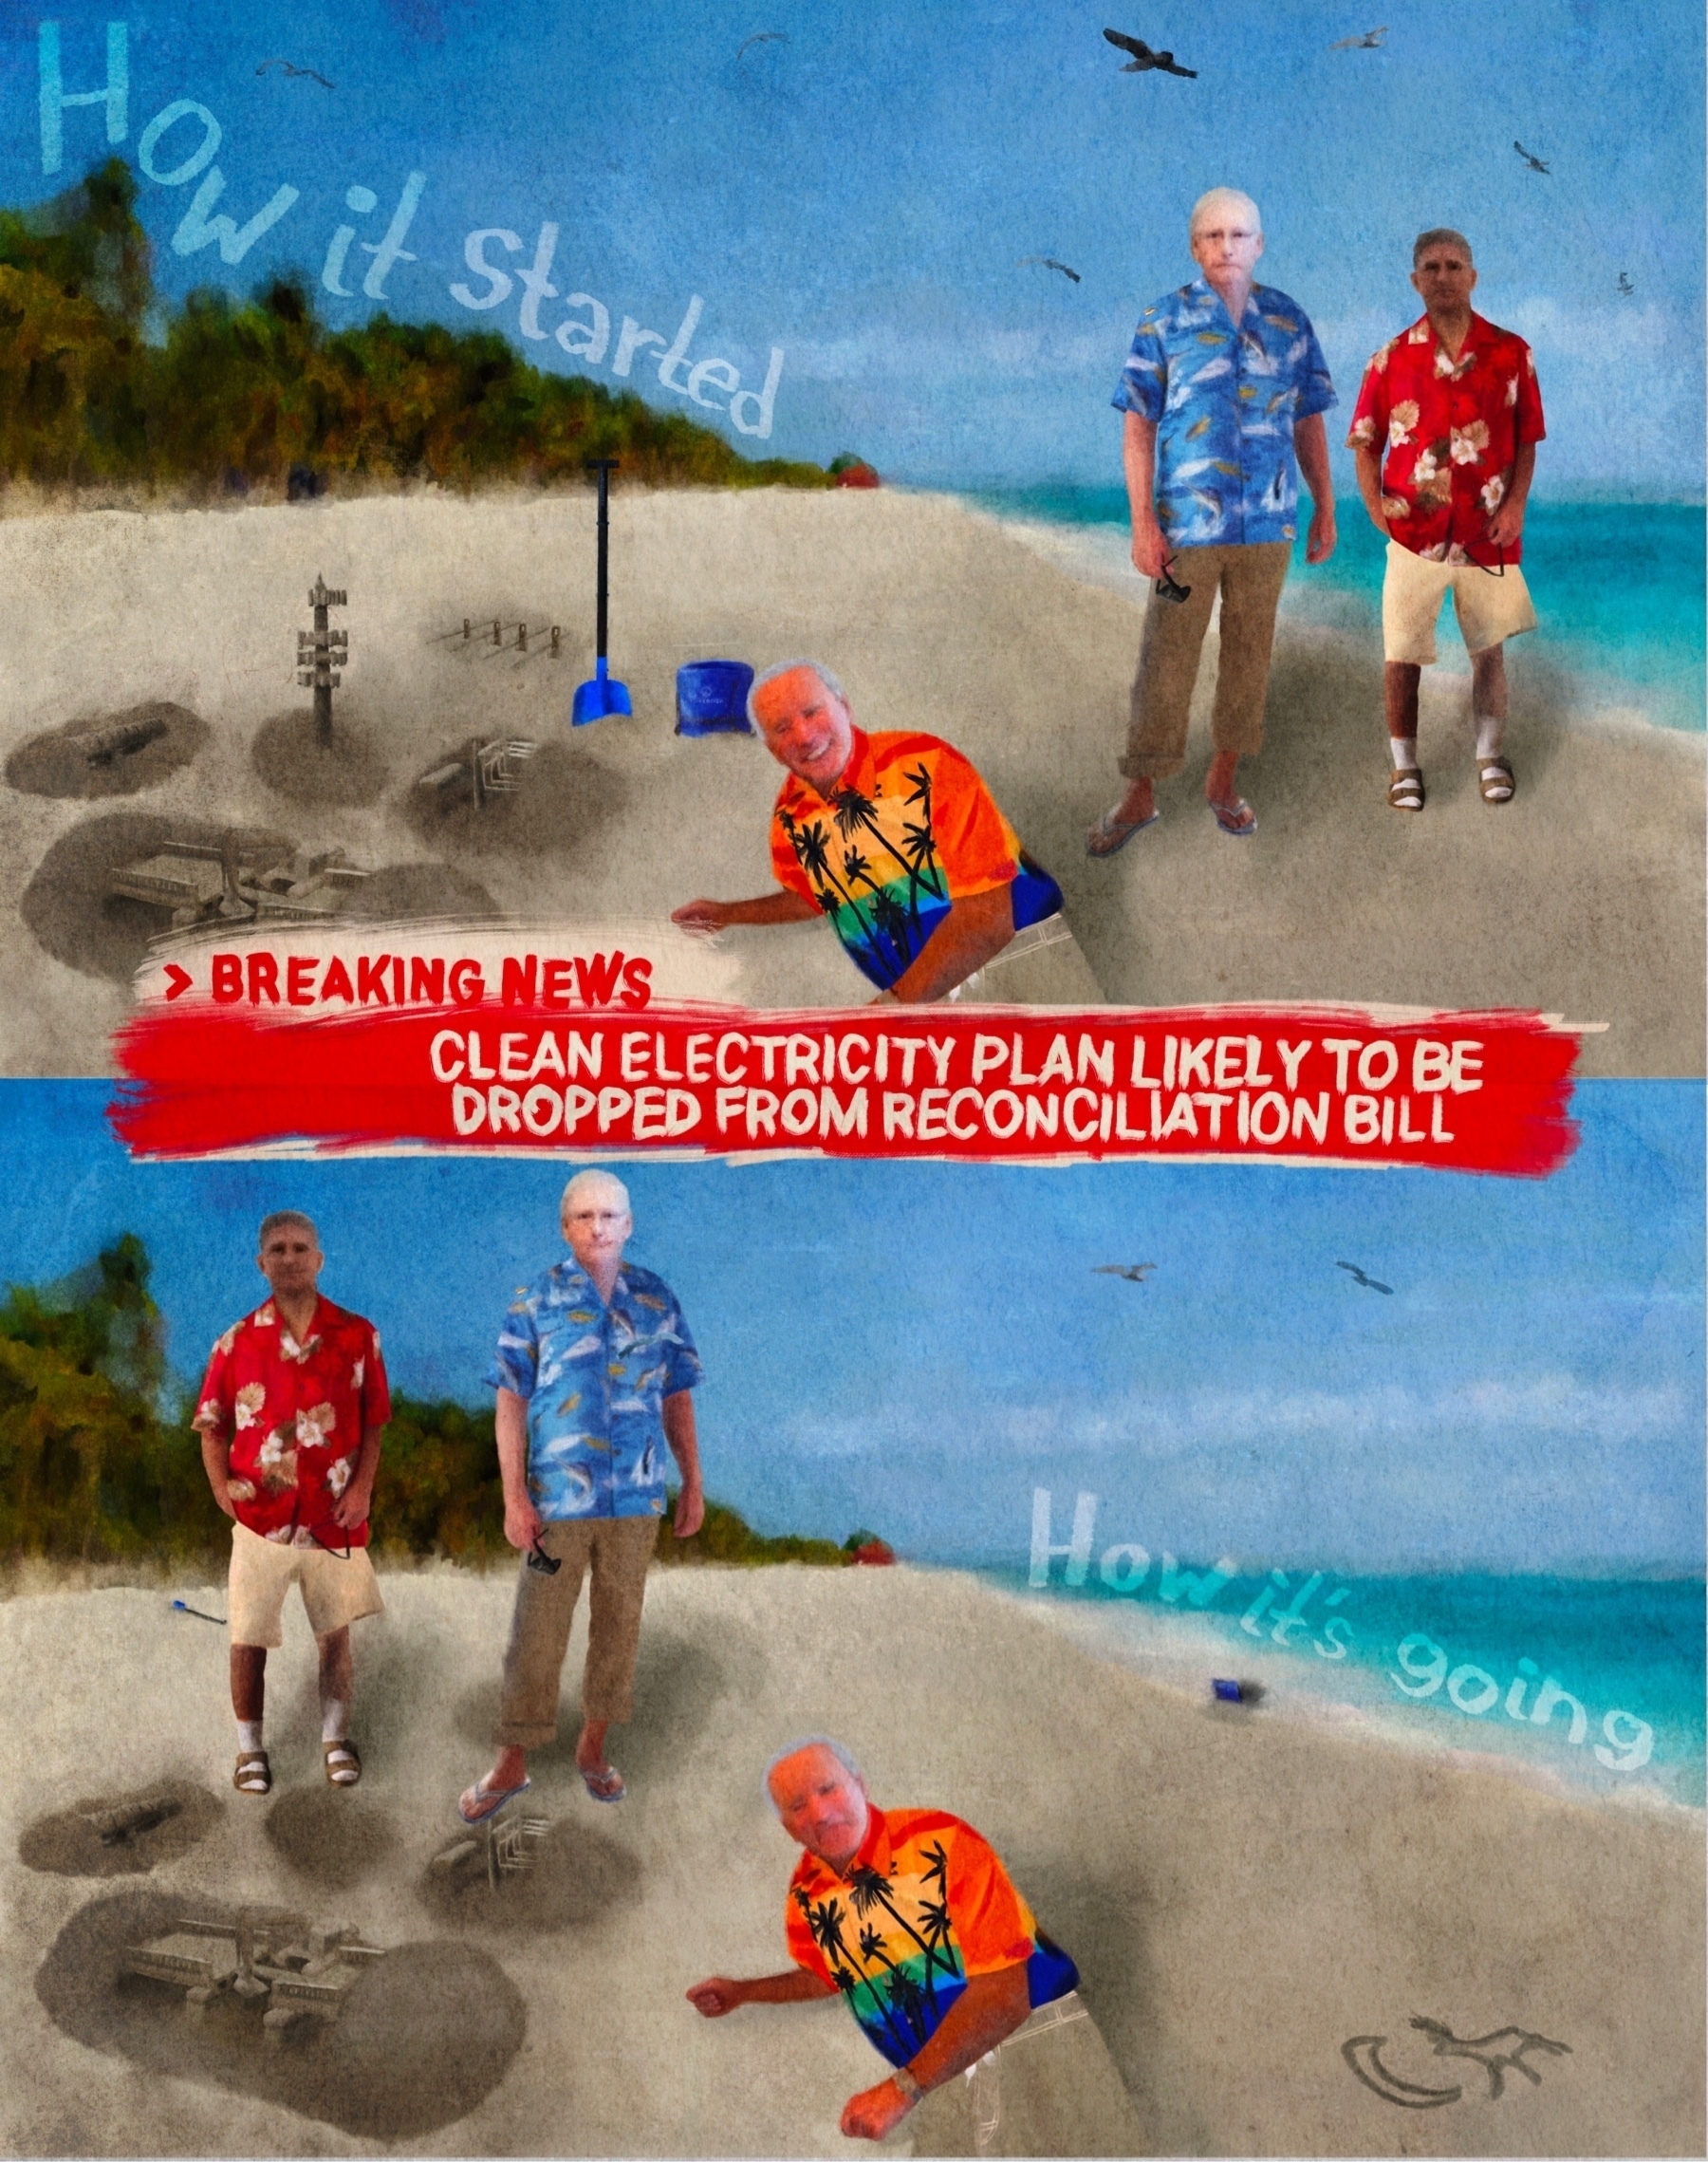
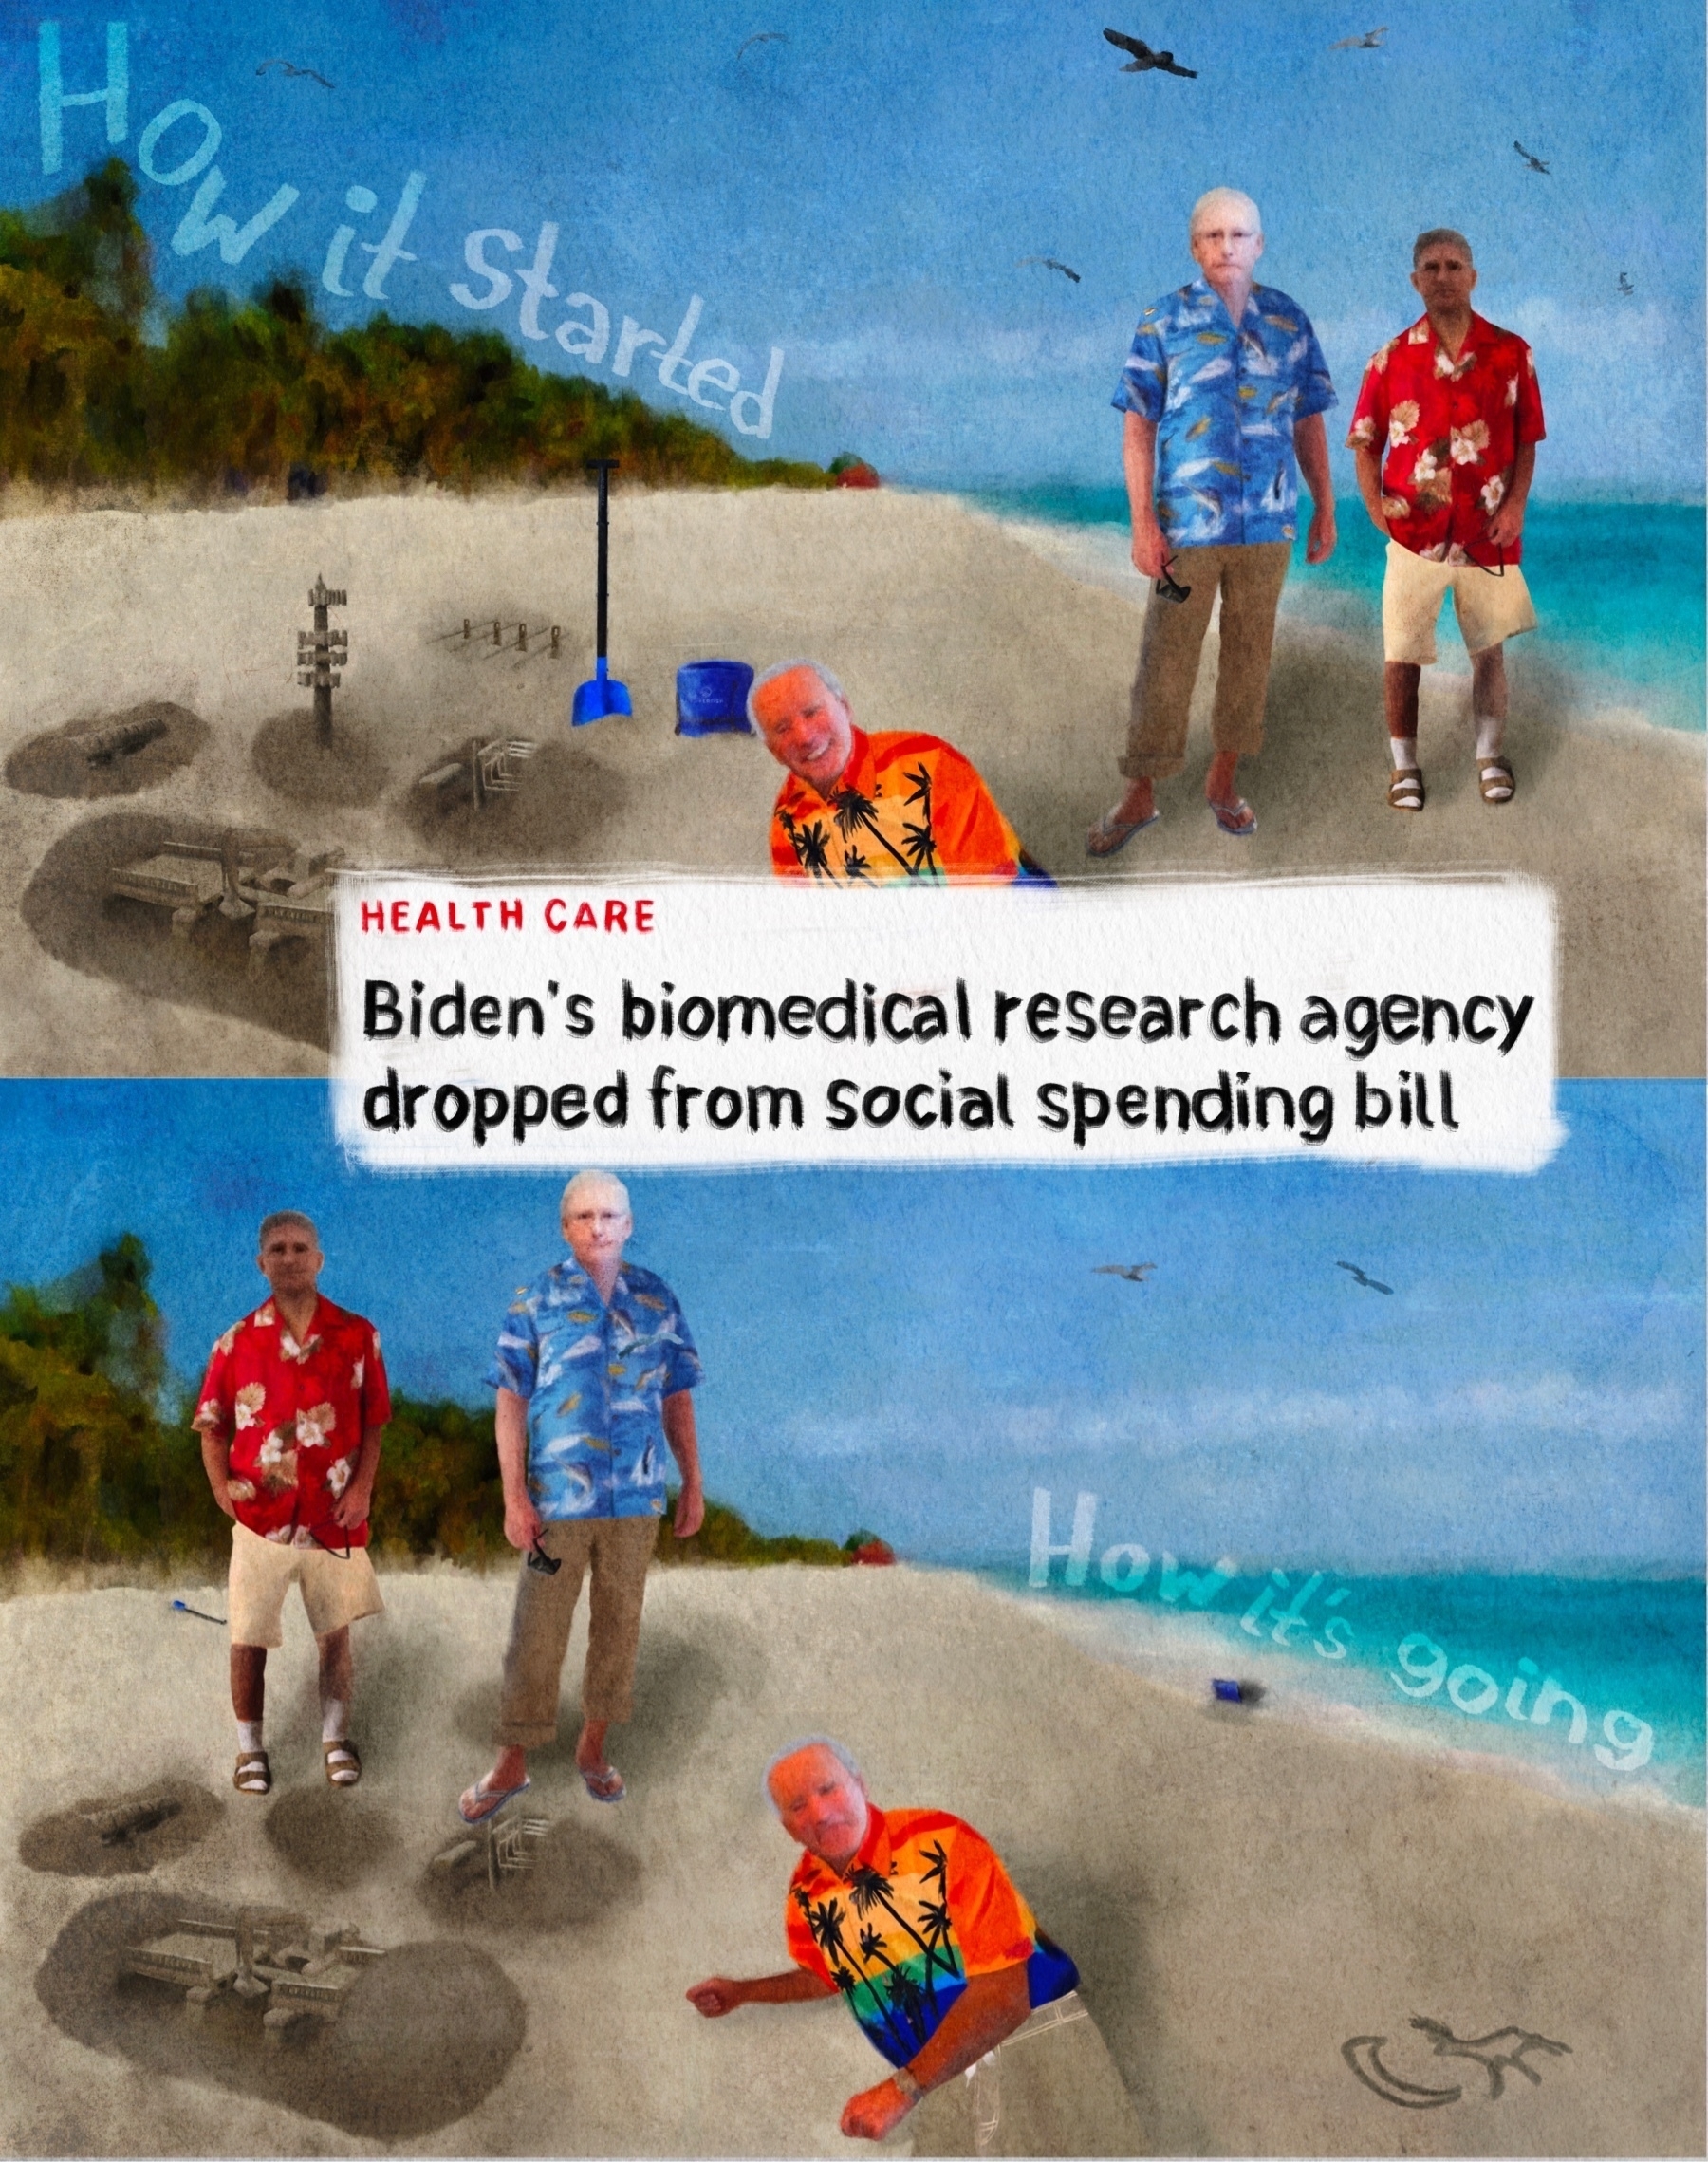
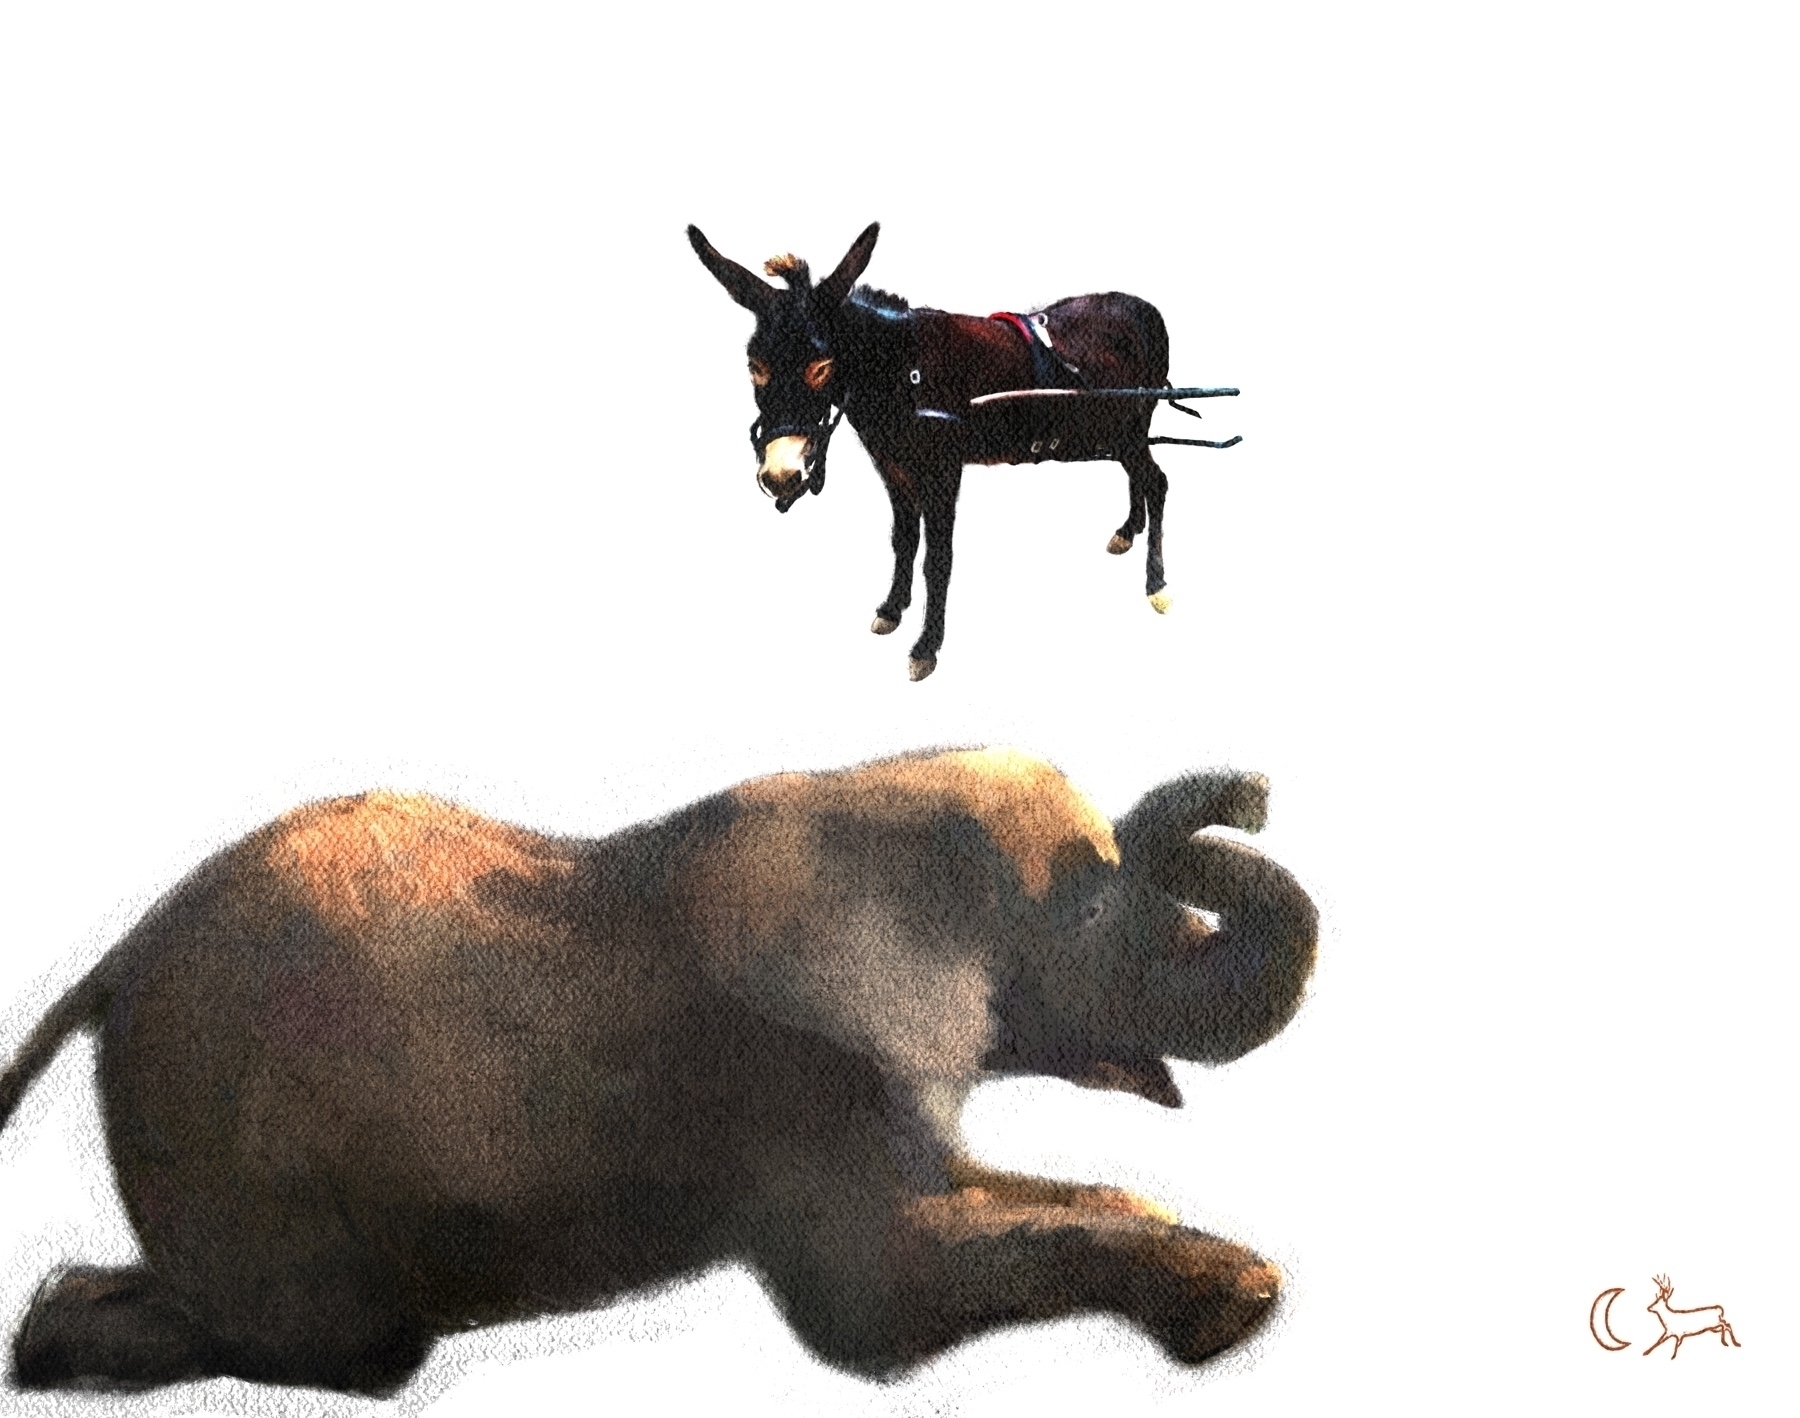
Rough draft of the art for the essay Imma write about the obstructionist agenda.
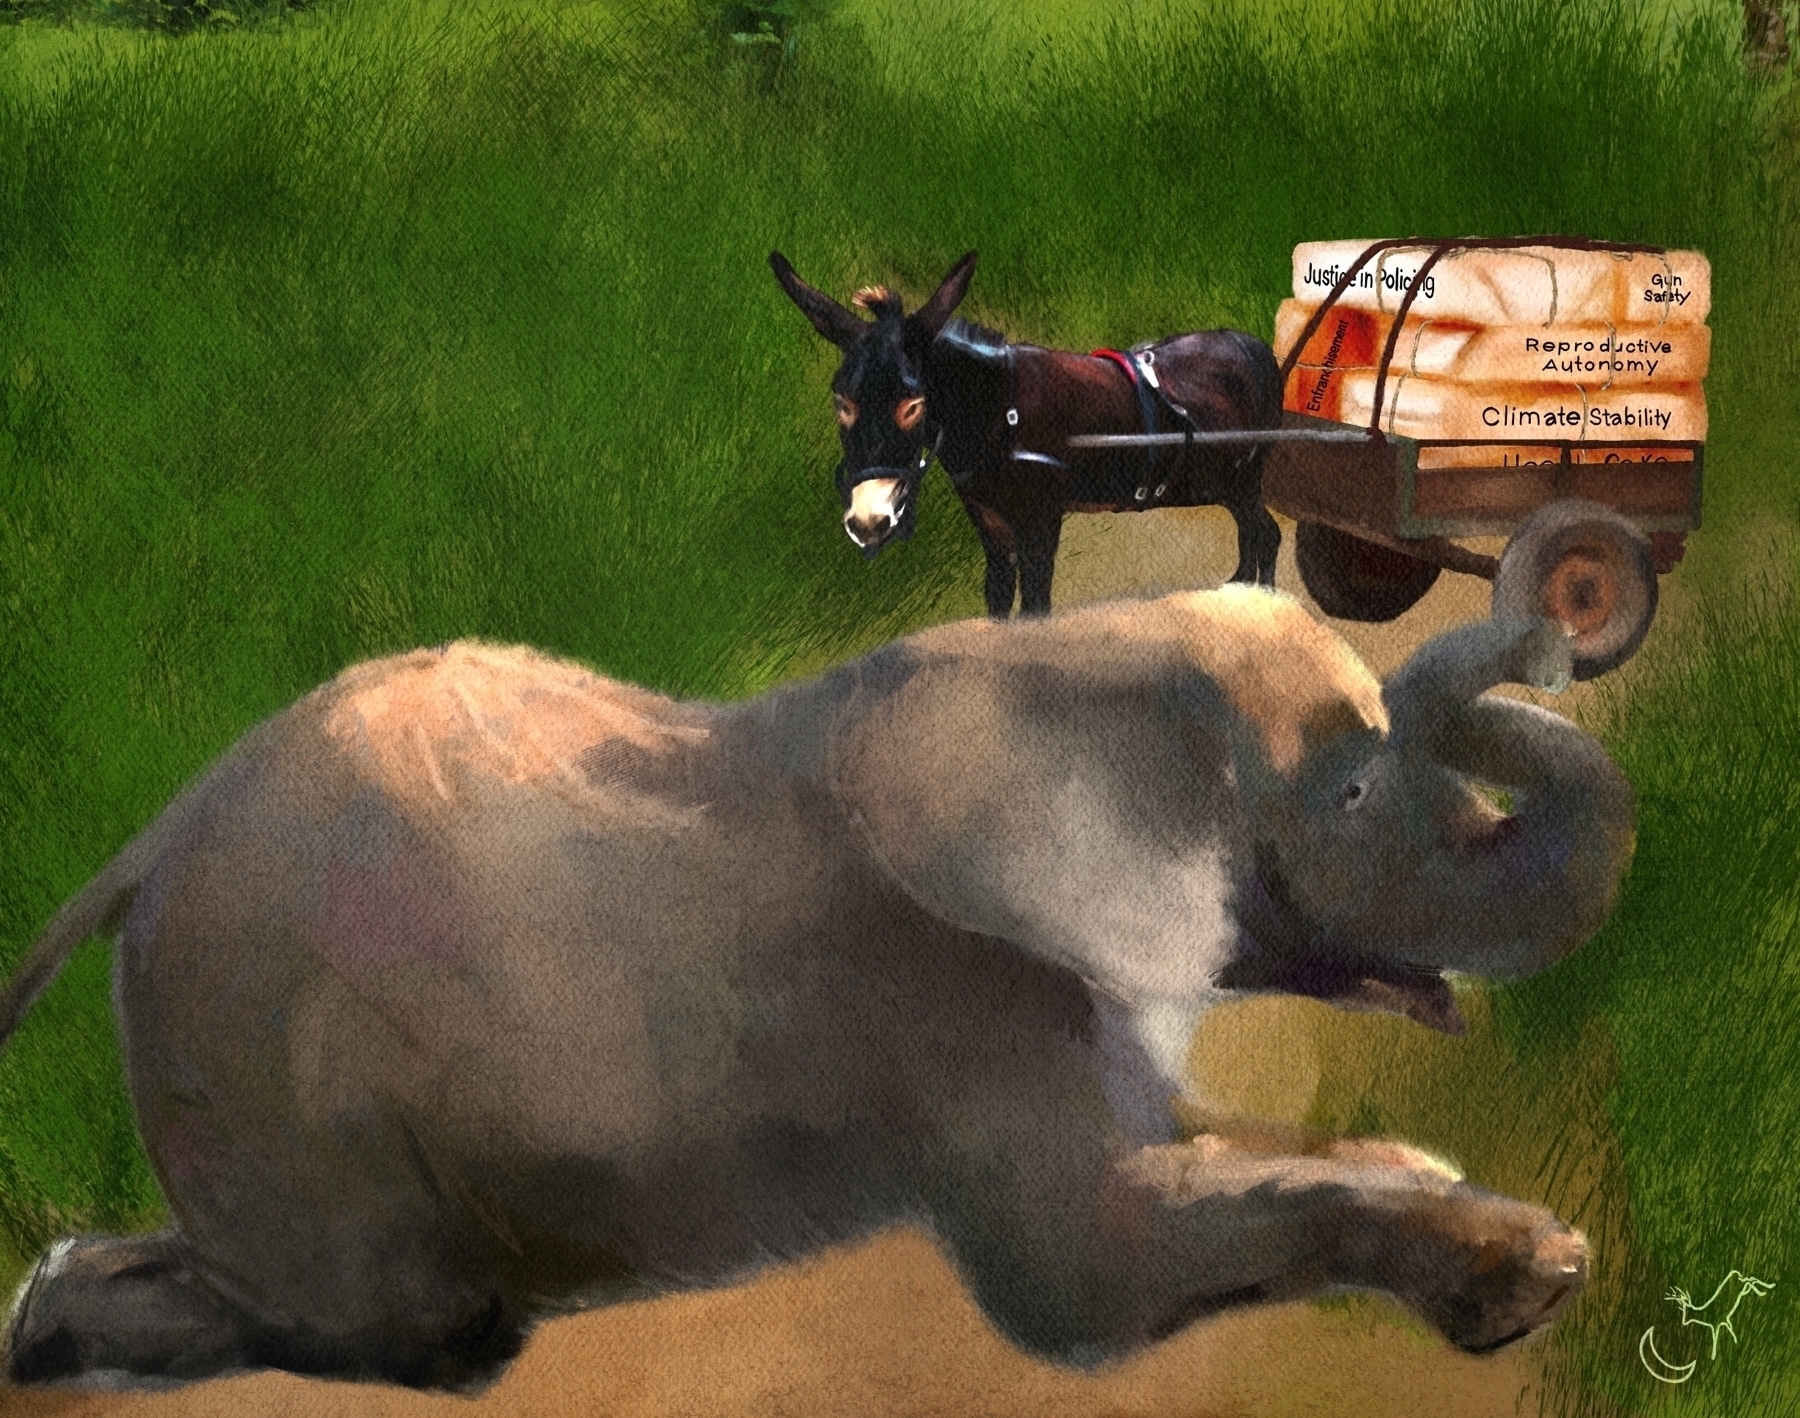
With some cargo

Inching closer to completion.
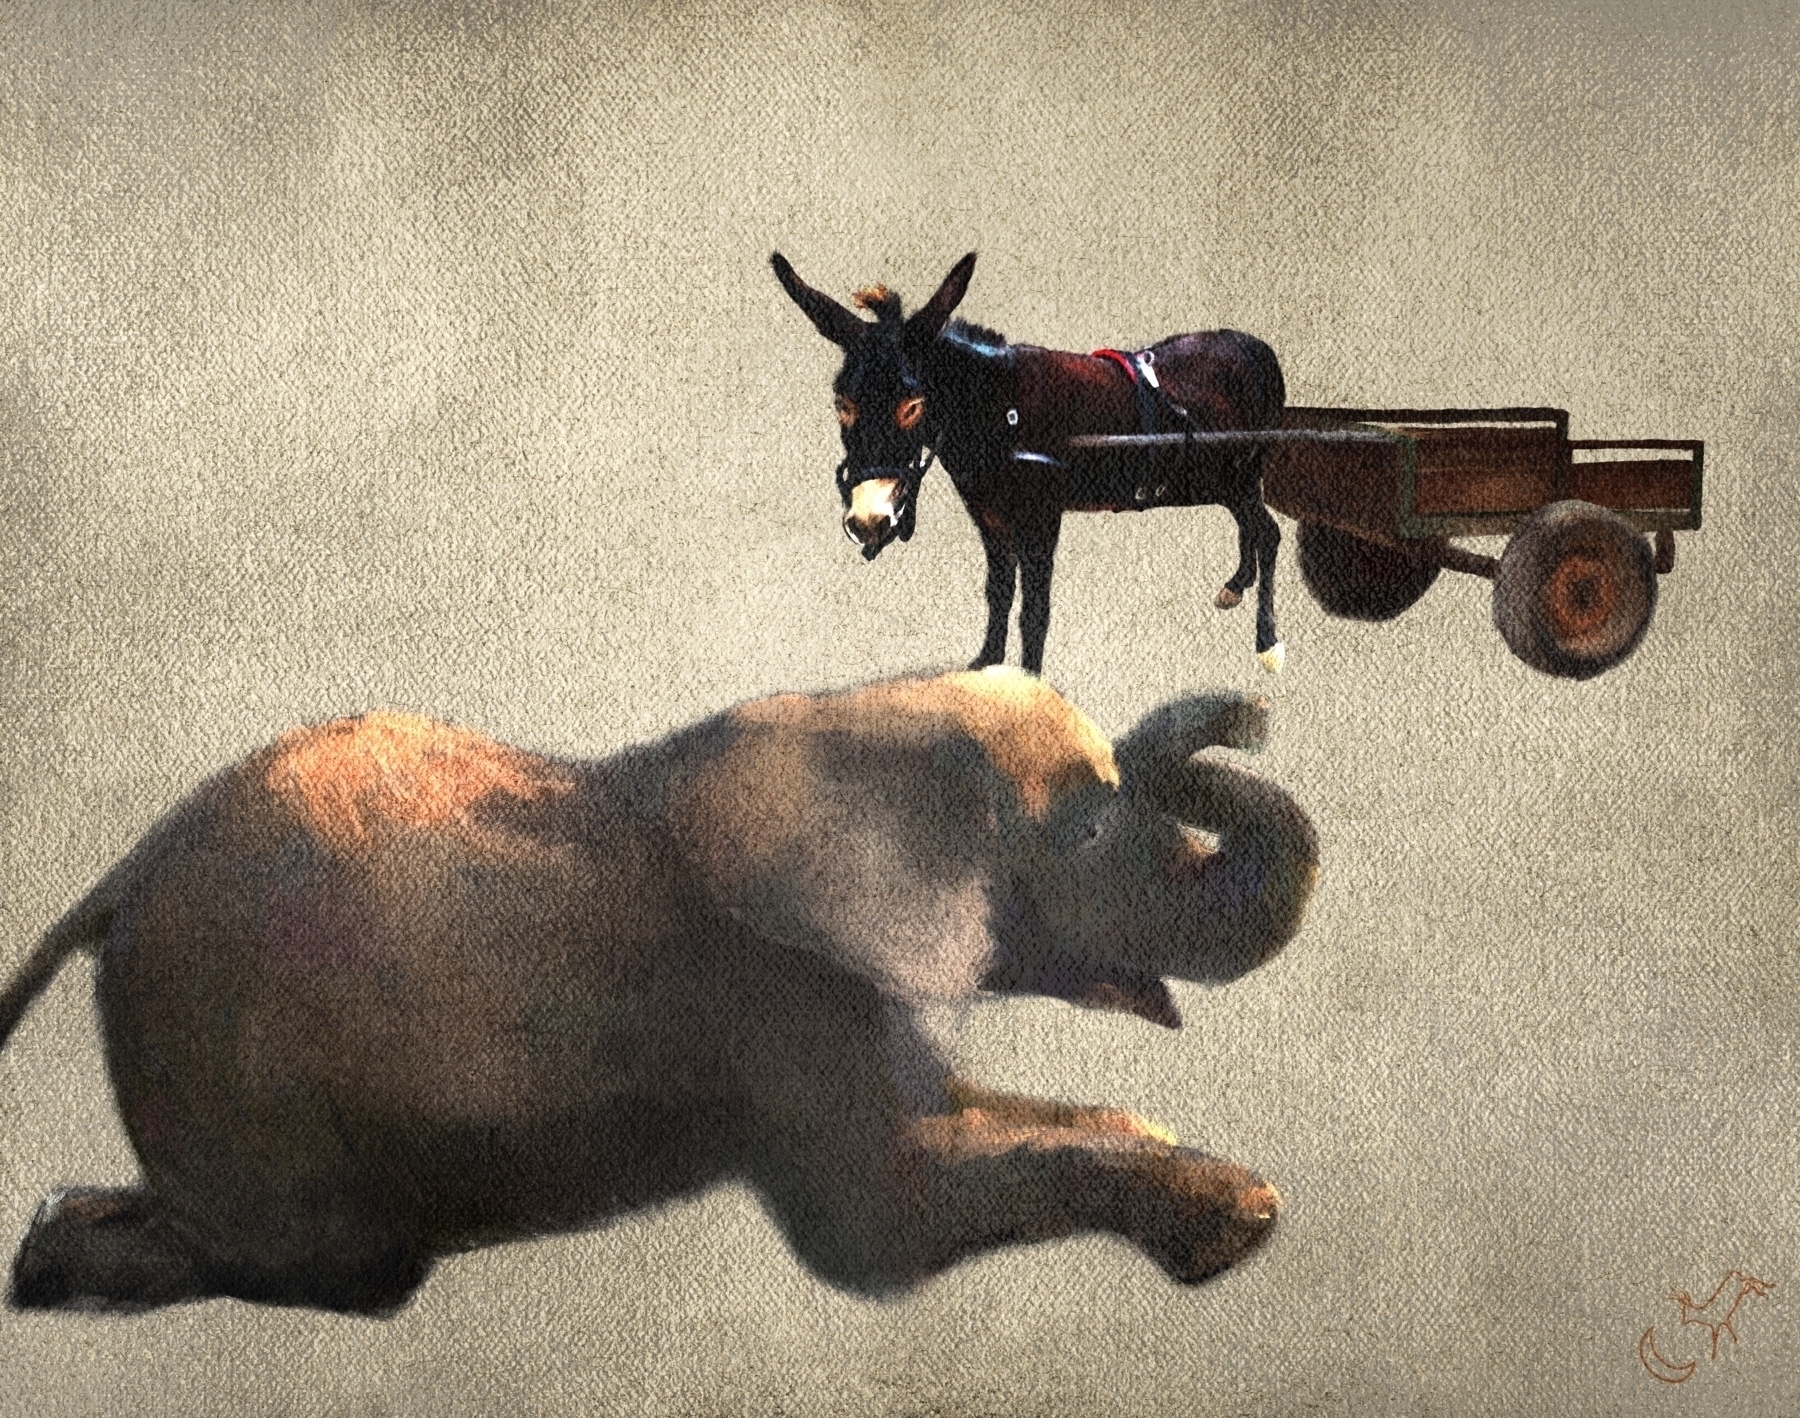
For anyone who may want to guess where the obstructionist agenda art is headed.
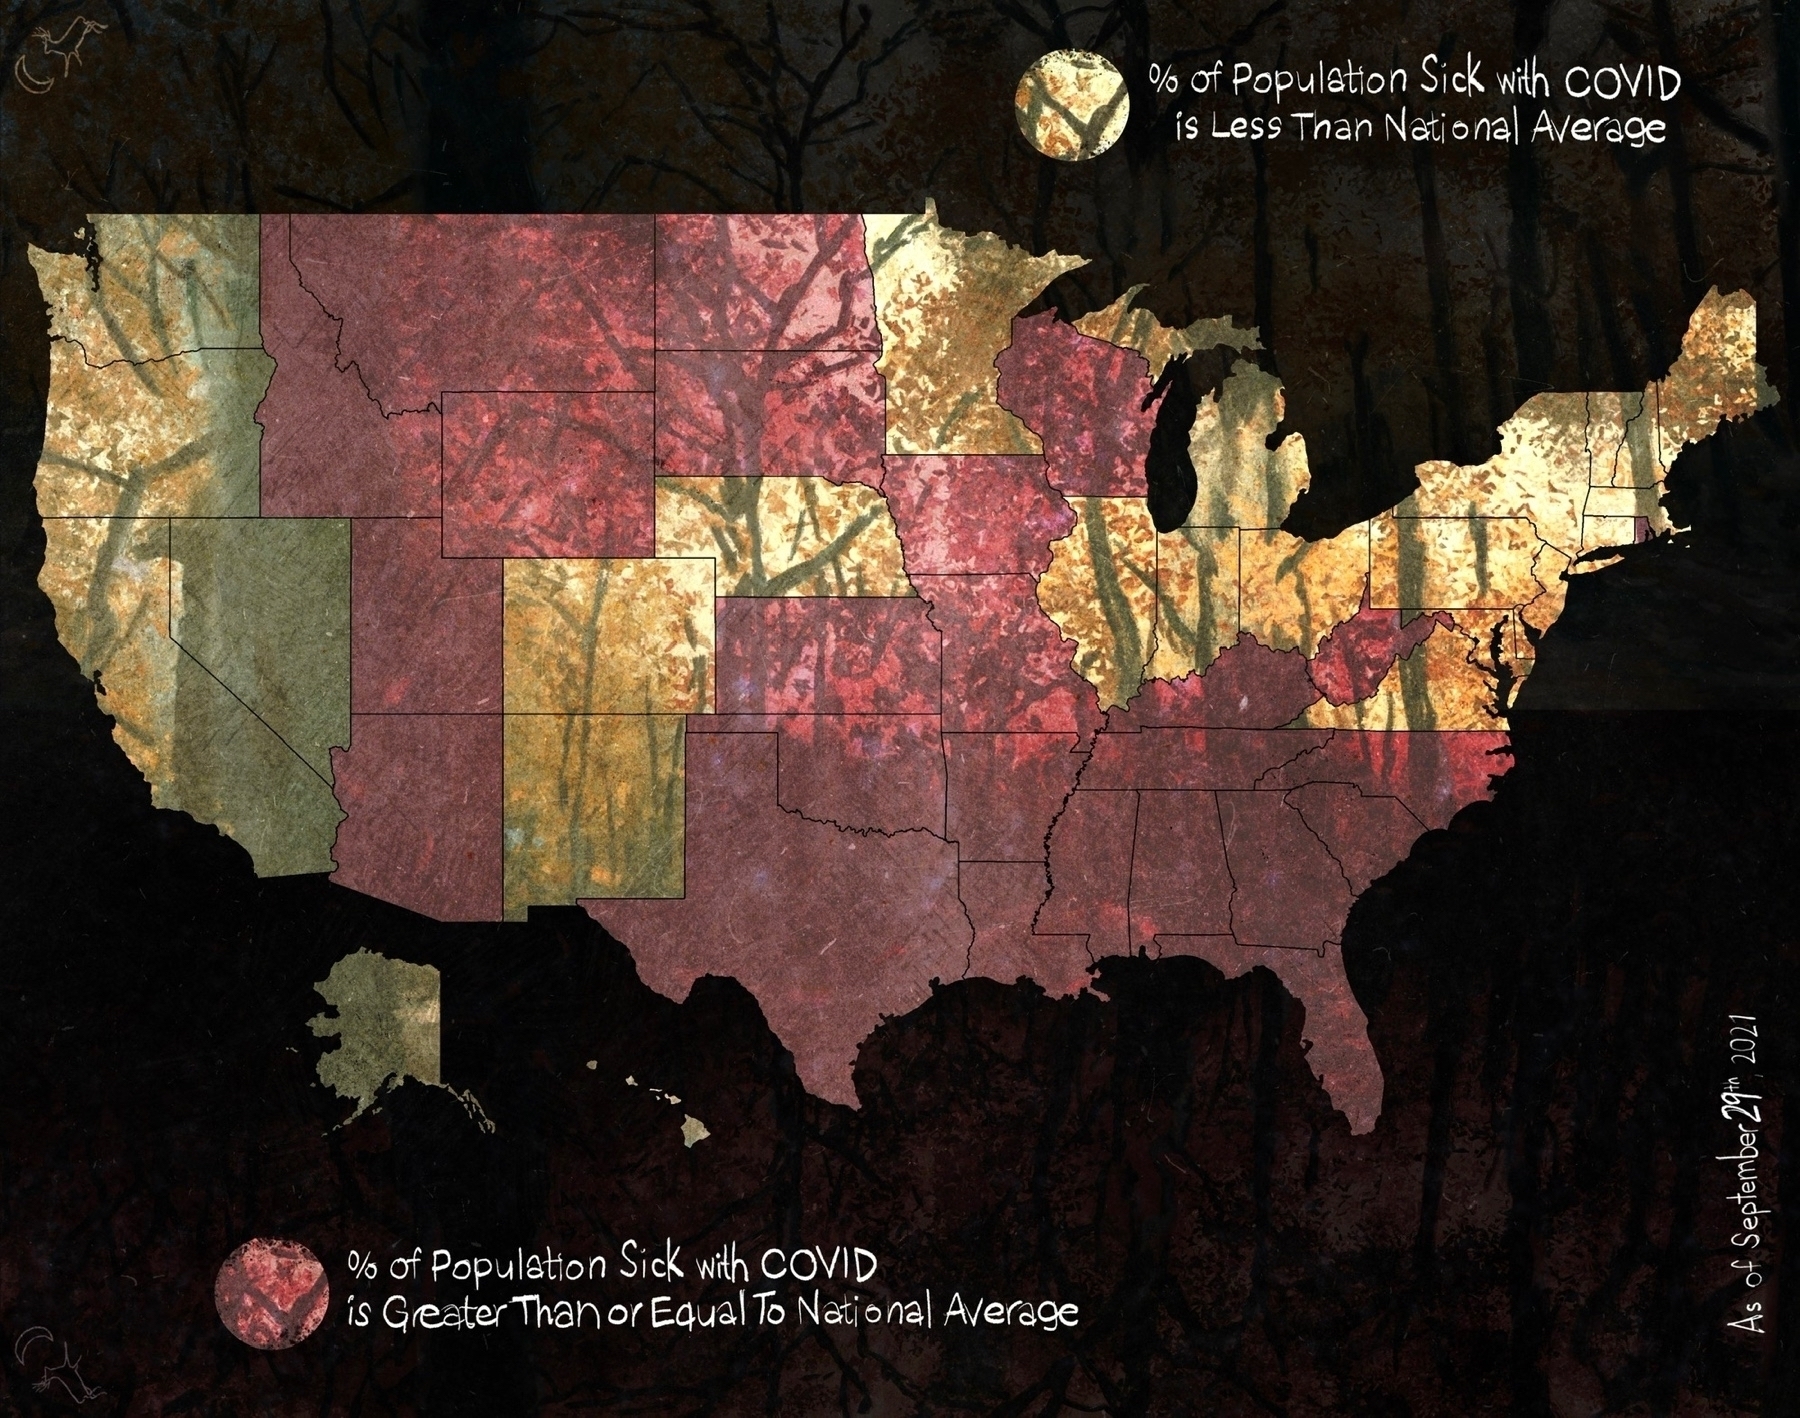
Tracking the monthly national averages for percent population sick with COVID and percent population killed by COVID.
% dead from #COVID by county by month from March 2020 through September 2021.
% of the population sick with #COVID by county by month from March 2020 through September 2021.
Two down, seventeen to go.
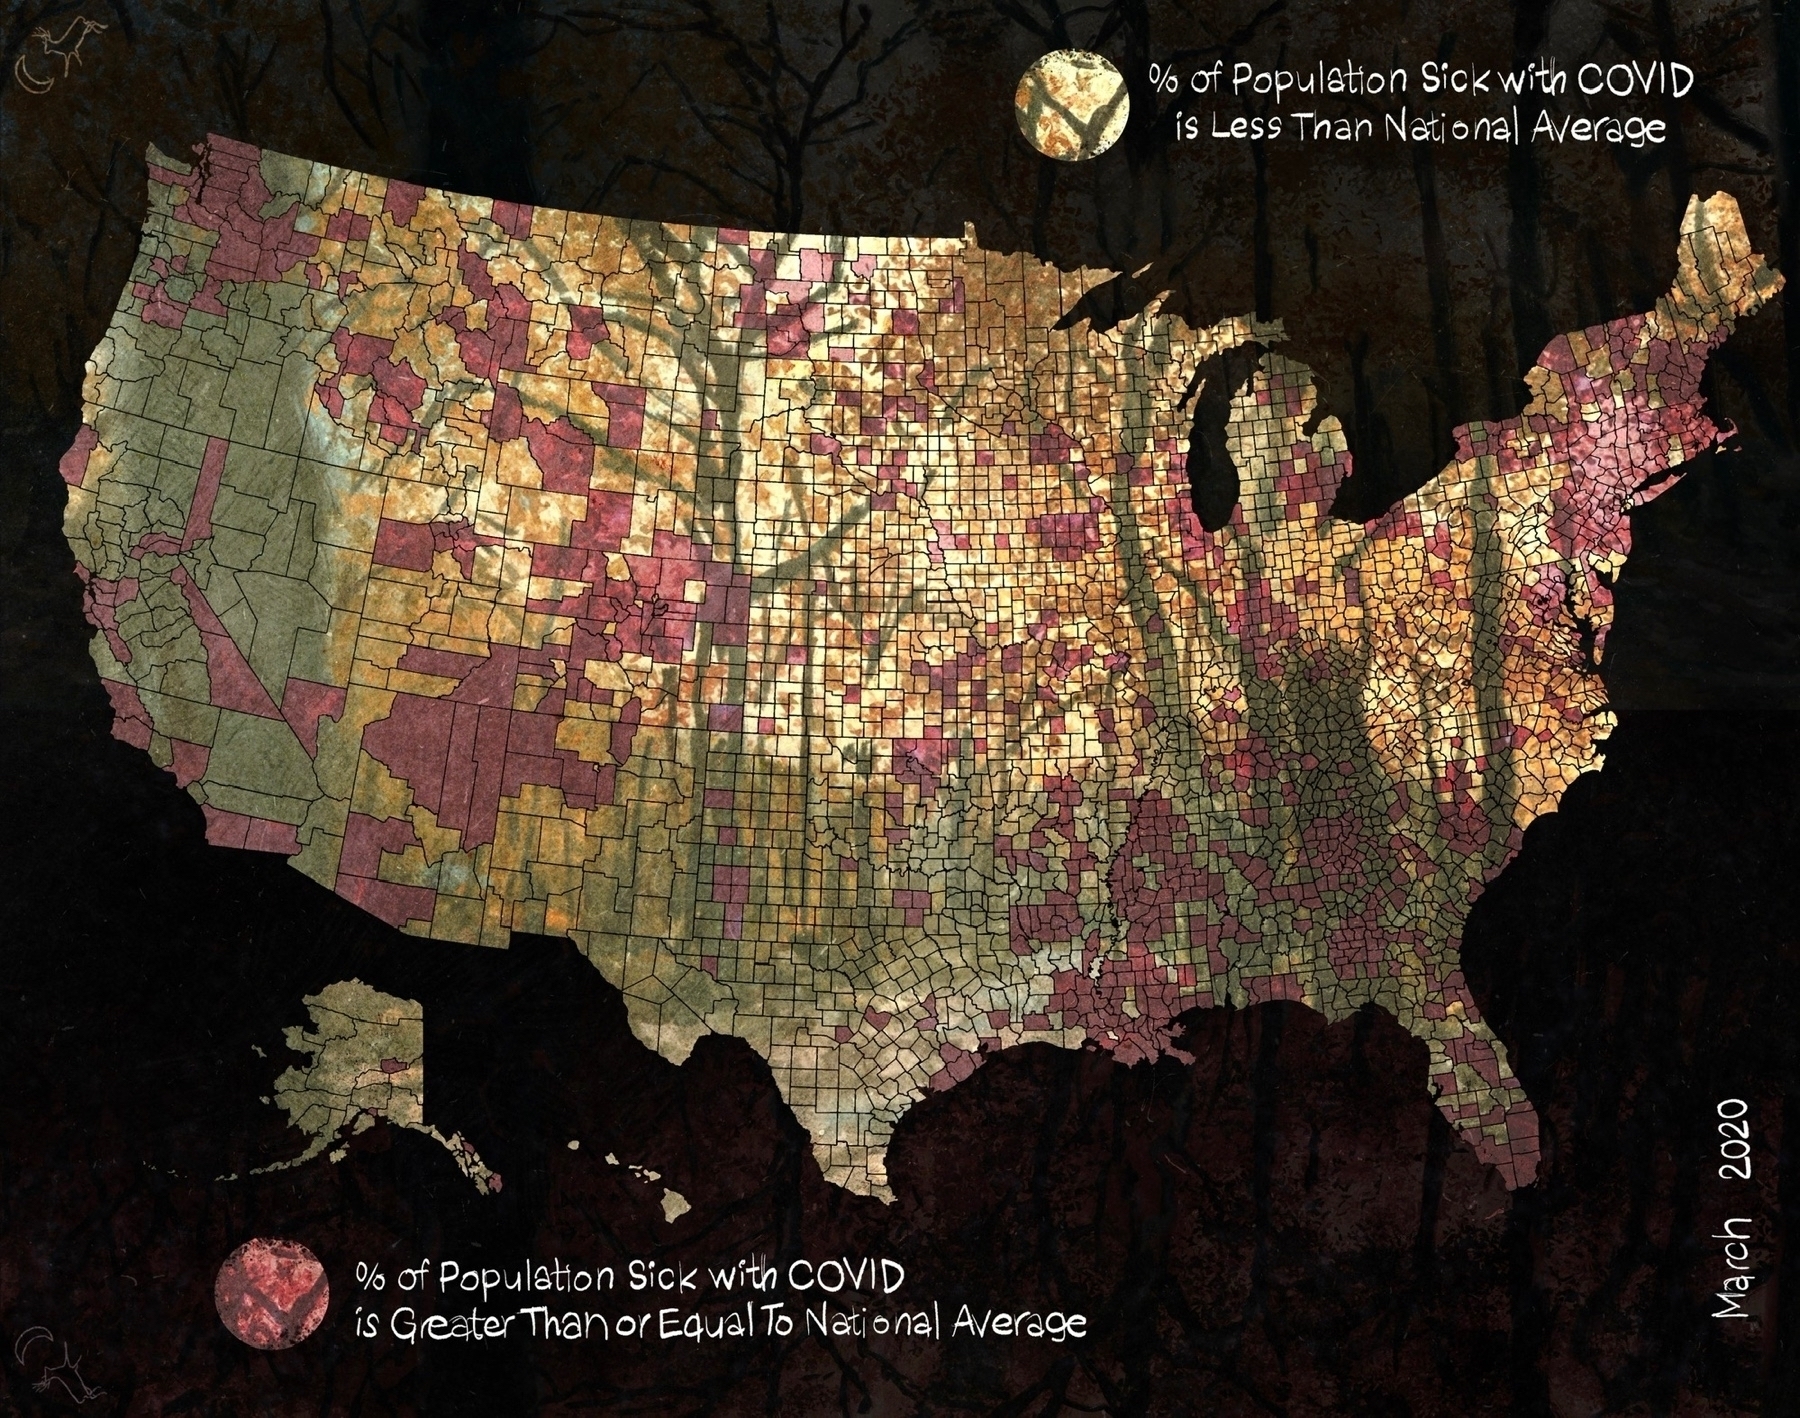
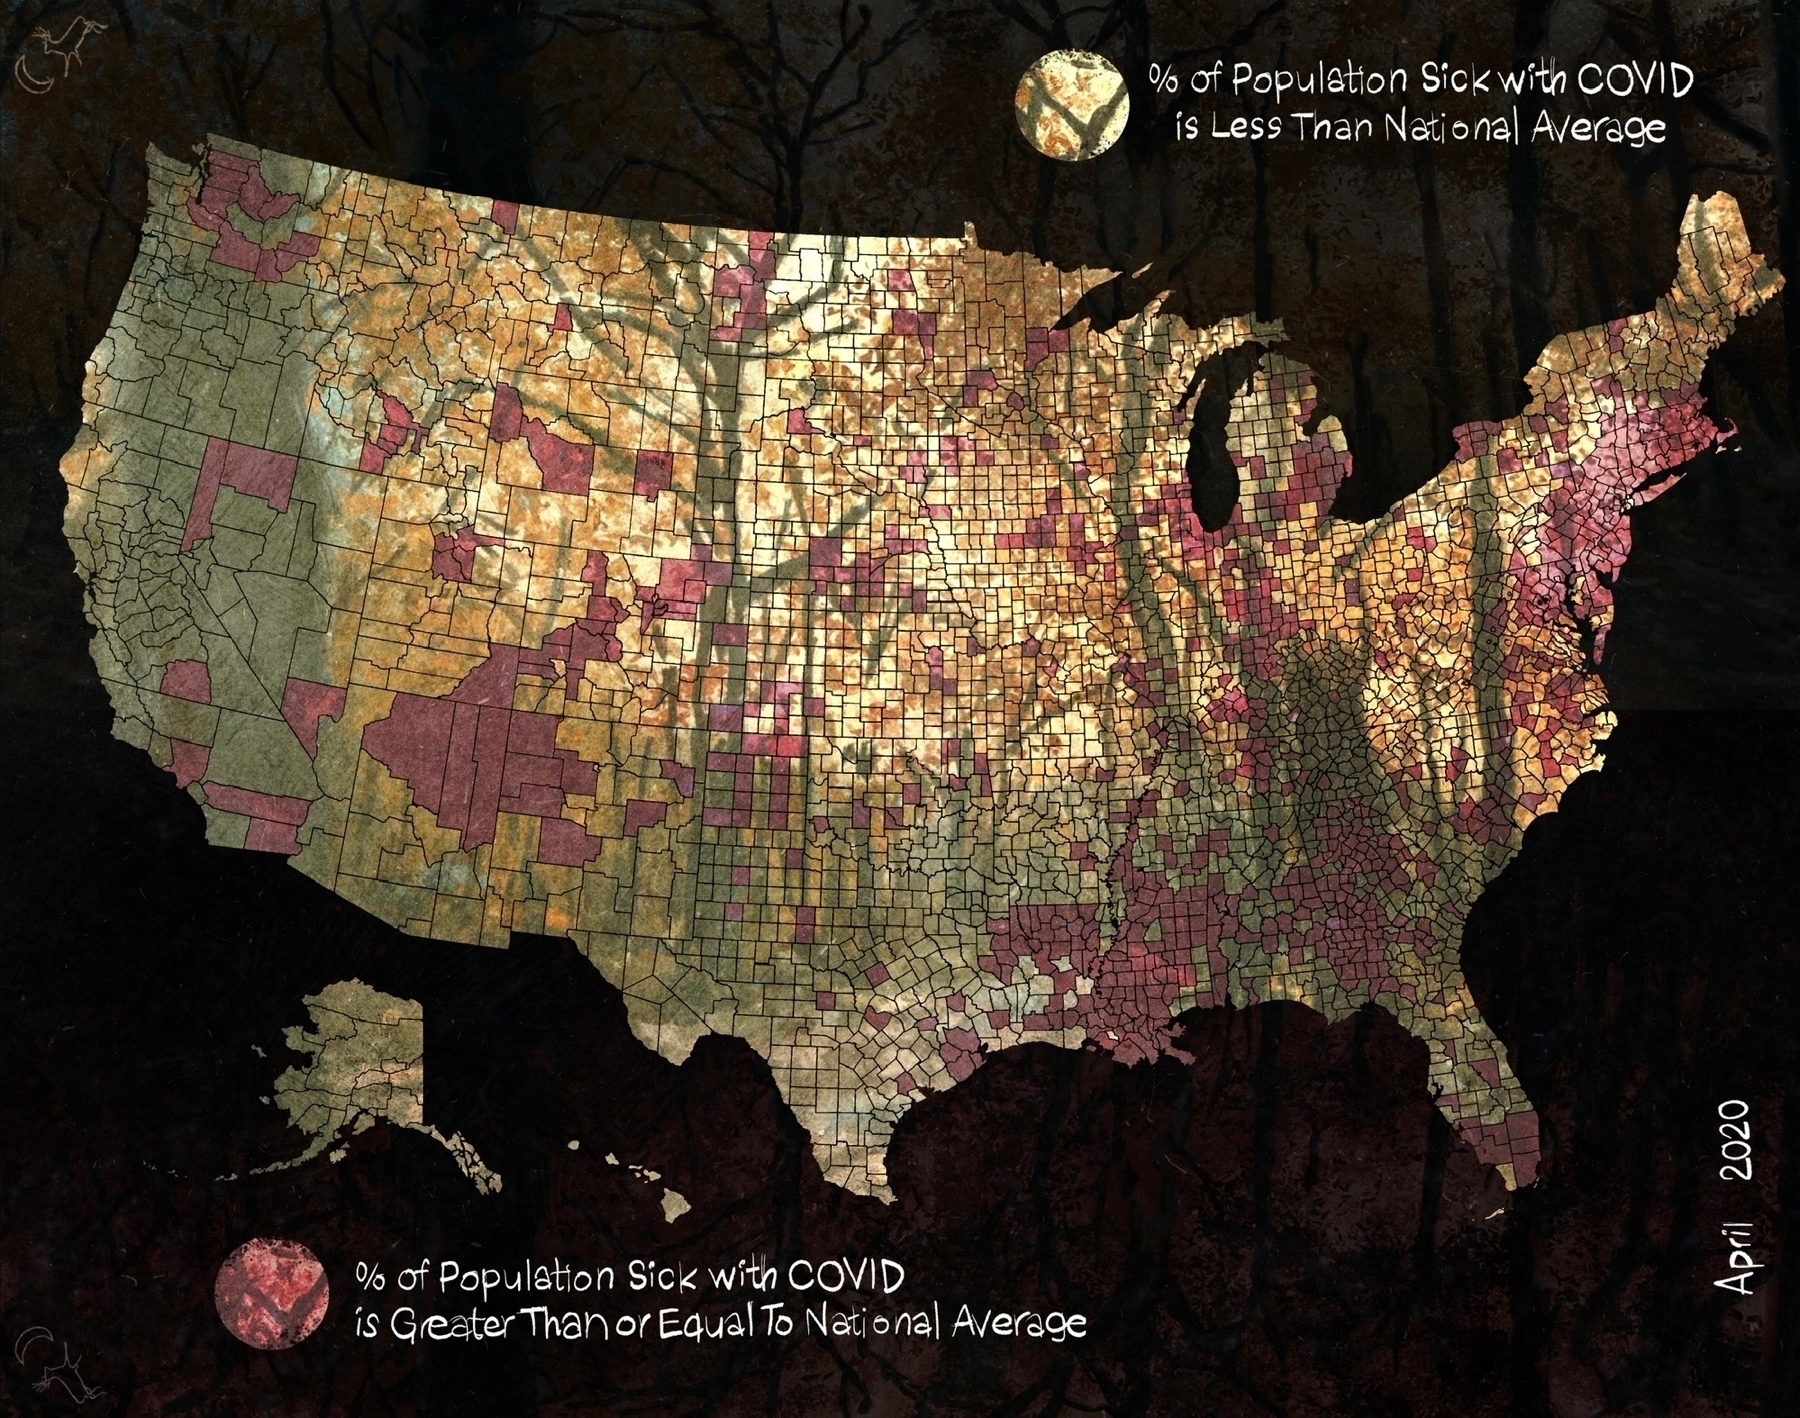
Gonna take a bit more time to pump out these county level maps. Have I mentioned there really are a sh$t ton of counties?
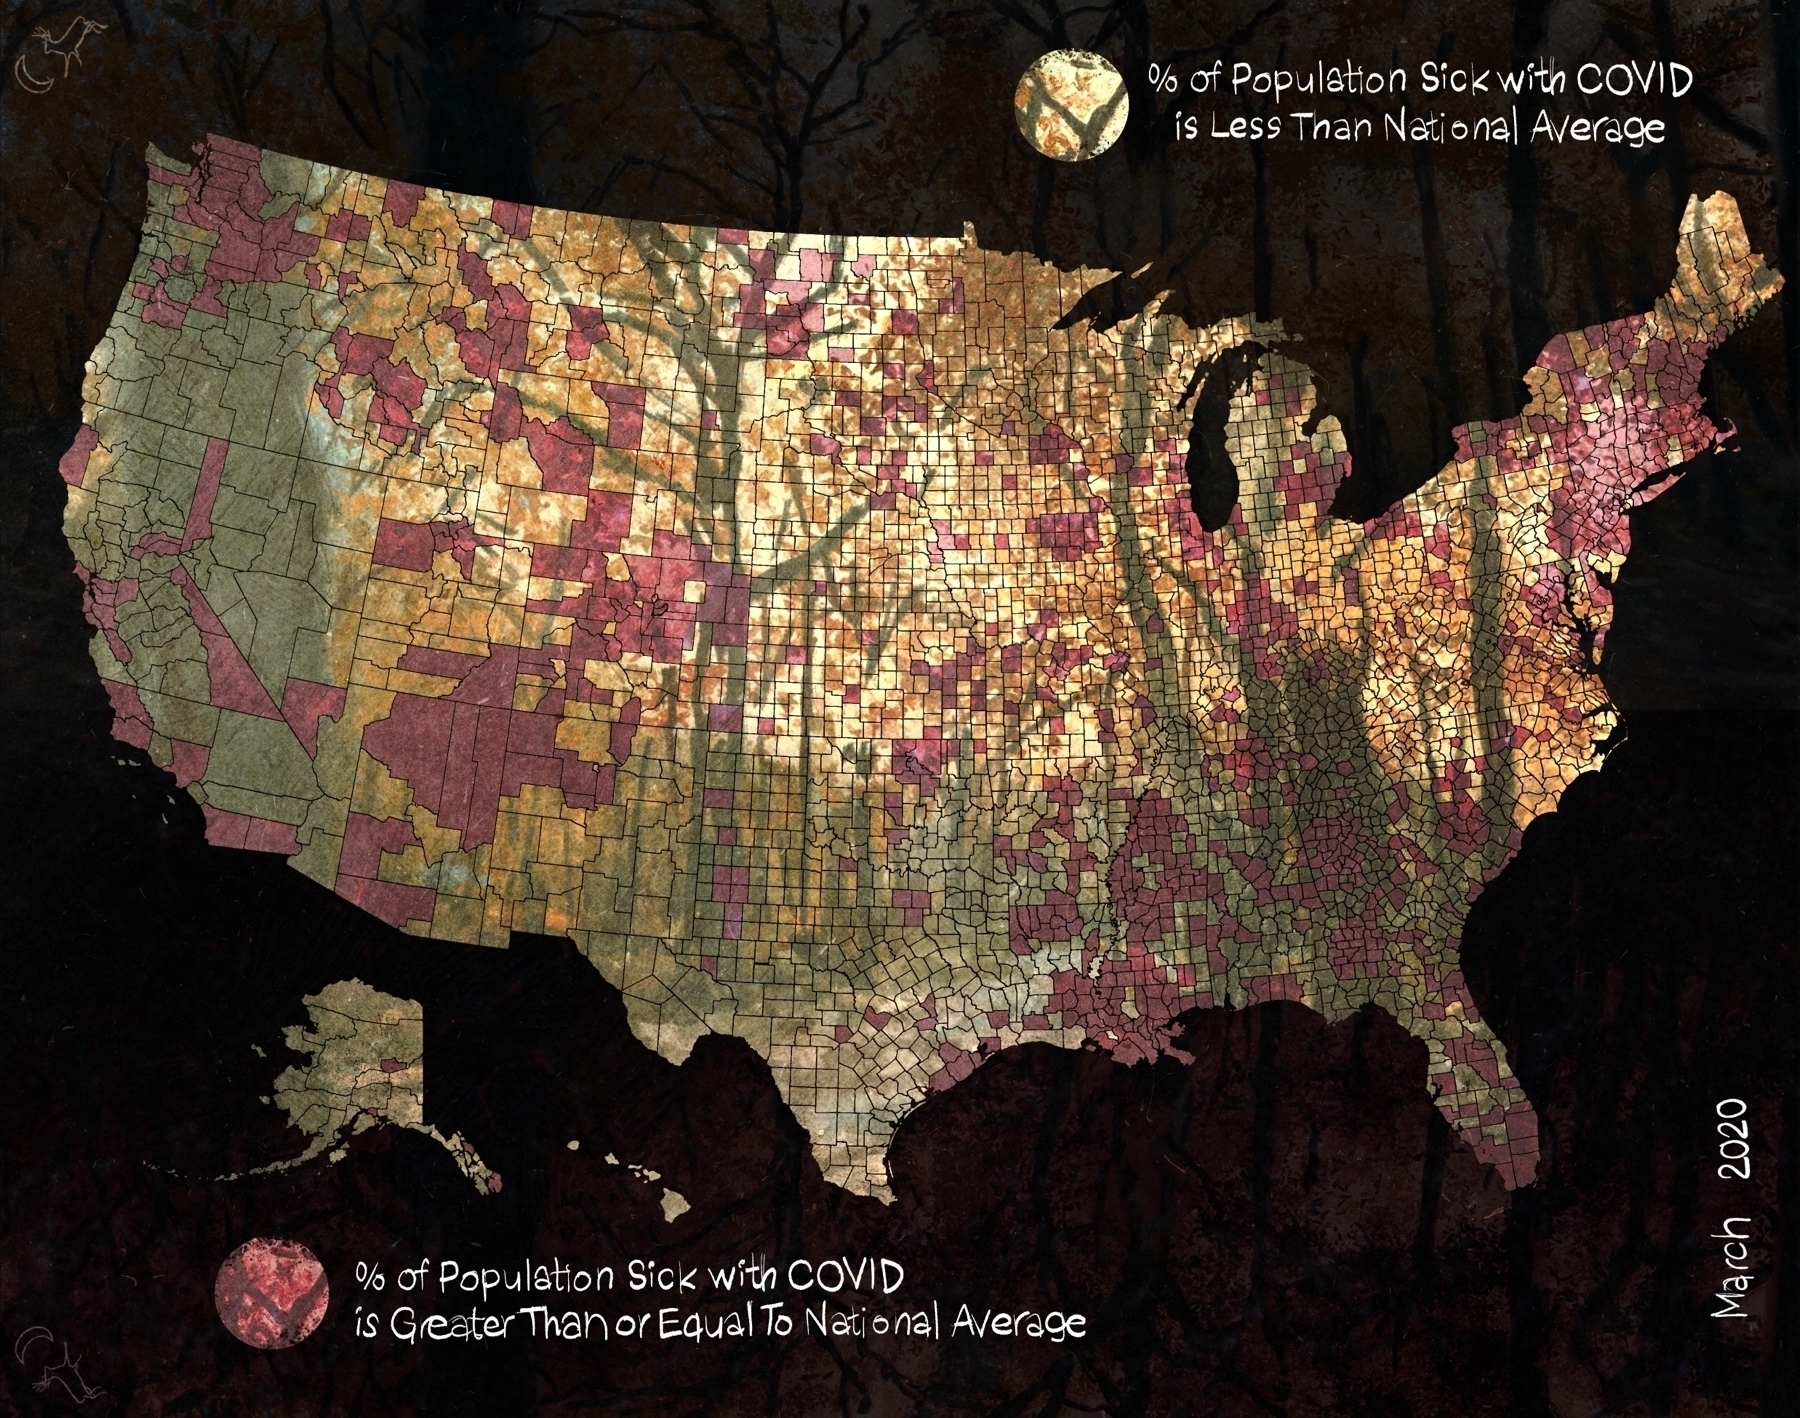
Started working on some art for an essay on the obstructionist agenda.
Total #COVID cases
